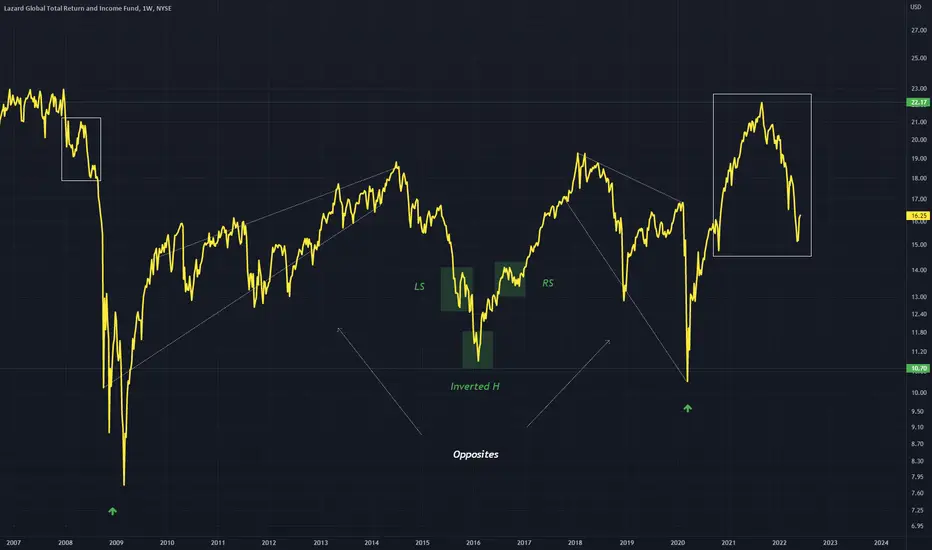
A chart for LGI, price is in a relatively tight range on this Weekly timeframe, it has repeated a chart pattern in an inverted fashion
White rectangle is where we are currently with price and should retest green as it did in the first situation inversely on the first white rectangle
Both are wedge patterns
White rectangle is where we are currently with price and should retest green as it did in the first situation inversely on the first white rectangle
Both are wedge patterns
Declinazione di responsabilità
Le informazioni ed i contenuti pubblicati non costituiscono in alcun modo una sollecitazione ad investire o ad operare nei mercati finanziari. Non sono inoltre fornite o supportate da TradingView. Maggiori dettagli nelle Condizioni d'uso.
Declinazione di responsabilità
Le informazioni ed i contenuti pubblicati non costituiscono in alcun modo una sollecitazione ad investire o ad operare nei mercati finanziari. Non sono inoltre fornite o supportate da TradingView. Maggiori dettagli nelle Condizioni d'uso.