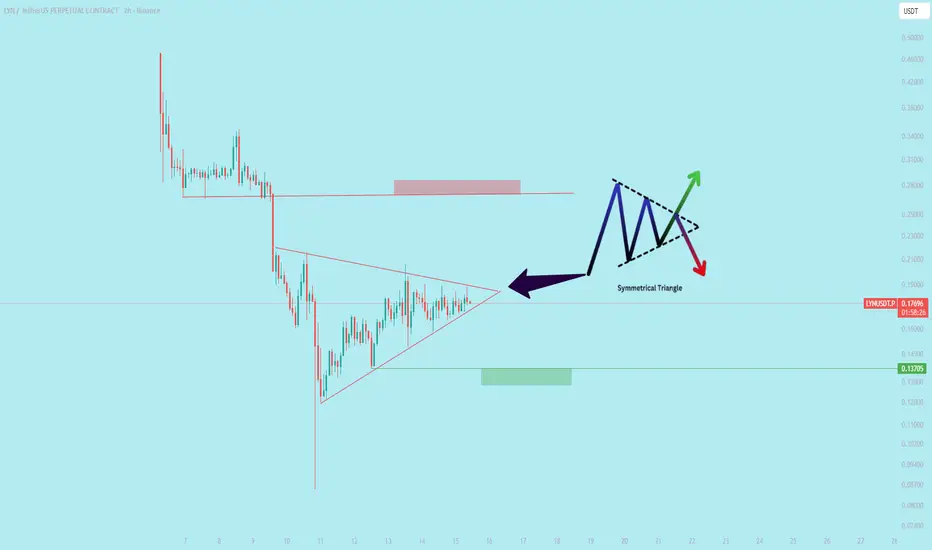
**$LYN** **Performing a symmetrical triangle** `symmetrical triangle is a chart pattern formed by two converging trendlines that connect a series of lower highs and higher lows. It represents a period of market consolidation and indecision, with neither buyers nor sellers having a clear advantage. The price range narrows as it moves toward the triangle's apex, or point of convergence.`
Declinazione di responsabilità
Le informazioni ed i contenuti pubblicati non costituiscono in alcun modo una sollecitazione ad investire o ad operare nei mercati finanziari. Non sono inoltre fornite o supportate da TradingView. Maggiori dettagli nelle Condizioni d'uso.
Declinazione di responsabilità
Le informazioni ed i contenuti pubblicati non costituiscono in alcun modo una sollecitazione ad investire o ad operare nei mercati finanziari. Non sono inoltre fornite o supportate da TradingView. Maggiori dettagli nelle Condizioni d'uso.