🔎Overview
____________________________________________________________
📌 How to Use
____________________________________________________________
📊 Chart Explanation
____________________________________________________________
👀 Observations
____________________________________________________________
💡 Why It Matters
____________________________________________________________
✅ Conclusion
____________________________________________________________
⚠️ Disclaimer
The Head and Shoulders Pattern is a classic bearish reversal formation that signals a potential change in trend from uptrend to downtrend.
It is formed by three peaks:
- Left Shoulder → Price rises, forms a peak, then retraces.
- Head → Price moves higher than the left shoulder, creating the tallest peak, then falls back.
- Right Shoulder → Price rises again but fails to surpass the head, showing loss of momentum.
- Neckline → A line drawn through the two troughs between the shoulders and the head. A breakdown below the neckline confirms bearish sentiment.
This pattern reflects weakening buying pressure and strengthening selling interest, often appearing at the end of strong rallies.
____________________________________________________________
📌 How to Use
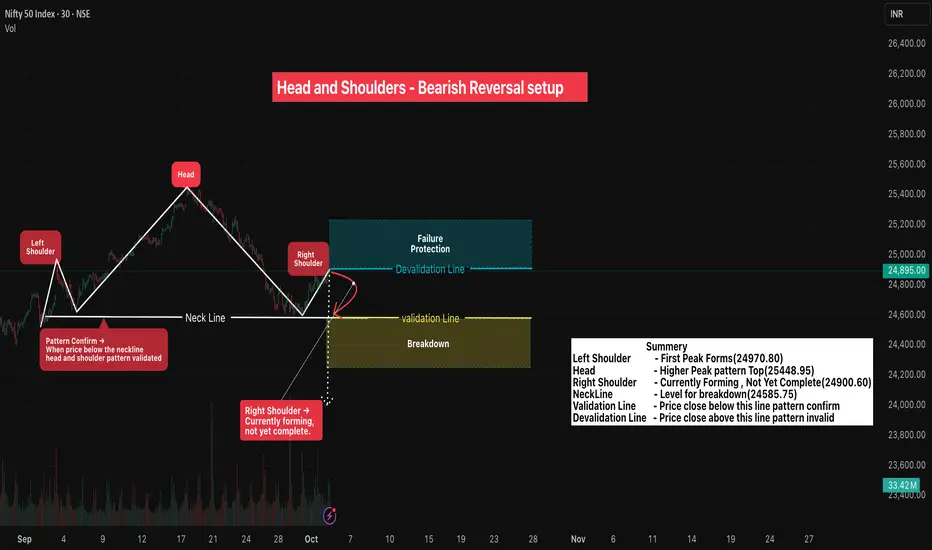
• ✅ Pattern Confirmed → When candle closes below the Validation Line
• ❌ Pattern Invalid → If candle closes above the Devalidation Line(Failure Protection).
• Protects against false signals & ensures structured risk management.
____________________________________________________________
📊 Chart Explanation
• Symbol →NIFTY
• Timeframe → 30m
• Left Shoulder Peak - 24970.30
• Head (Highest Peak) - 25448.95
• Right Shoulder Peak - 24900.80
• Neckline → Drawn by connecting the two troughs between shoulders and head.
• Validation Level → 24,585.75 → Close below = Pattern Confirmed.
• Devalidation Level → 24,910.65 → Close above = Pattern Invalid.
____________________________________________________________
👀 Observations
- The right shoulder often appears weaker, highlighting reduced buyer confidence.
- Once the neckline is tested multiple times, probability of a breakdown increases.
- Volume generally decreases during formation and expands during breakdown, strengthening confirmation.
- This setup helps traders anticipate major reversals rather than chasing late entries.
- Head and Shoulders is widely followed, making it self-fulfilling as many traders act on the same signal.
____________________________________________________________
💡 Why It Matters
Head & Shoulders is one of the most reliable reversal patterns, giving clear validation/devalidation levels for structured risk management. It helps avoid false breakouts and provides traders with predefined stop-loss and target zones.
____________________________________________________________
✅ Conclusion
Breakdown below the Validation Lineconfirms bearish reversal bias. Combine this with broader market context, volume confirmation, and disciplined position sizing for effective trading decisions.
____________________________________________________________
⚠️ Disclaimer
📘 For educational purposes only.
🙅 Not SEBI registered.
❌ Not a buy/sell recommendation.
🧠 Purely a learning resource.
📊 Not Financial Advice.
Declinazione di responsabilità
Le informazioni ed i contenuti pubblicati non costituiscono in alcun modo una sollecitazione ad investire o ad operare nei mercati finanziari. Non sono inoltre fornite o supportate da TradingView. Maggiori dettagli nelle Condizioni d'uso.
Declinazione di responsabilità
Le informazioni ed i contenuti pubblicati non costituiscono in alcun modo una sollecitazione ad investire o ad operare nei mercati finanziari. Non sono inoltre fornite o supportate da TradingView. Maggiori dettagli nelle Condizioni d'uso.