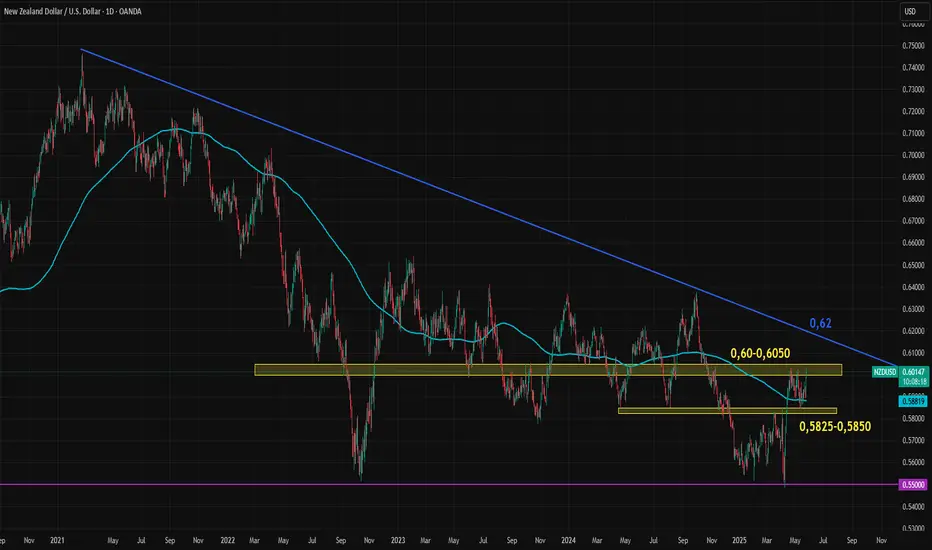
NZDUSD has been forming a descending triangle pattern since 2020. After the wide swings triggered by the COVID-19 shock, price action has gradually contracted. The downside has been limited near 0.55, while the topside has followed a clear descending trendline, currently sitting around 0.62.
Following a brief surge in April, NZDUSD has entered a short-term flat trend, with two key support and resistance zones capping volatility, potentially the calm before the storm. The 0.5825–0.5850 zone acts as support, while 0.60–0.6050 serves as resistance.
This week, major events including the RBNZ decision, FOMC minutes, U.S. consumer sentiment, PCE, and GDP data could break this low-volatility pattern. A decisive move toward either the upper or lower boundary of the descending triangle may be imminent.
Declinazione di responsabilità
Le informazioni ed i contenuti pubblicati non costituiscono in alcun modo una sollecitazione ad investire o ad operare nei mercati finanziari. Non sono inoltre fornite o supportate da TradingView. Maggiori dettagli nelle Condizioni d'uso.
Declinazione di responsabilità
Le informazioni ed i contenuti pubblicati non costituiscono in alcun modo una sollecitazione ad investire o ad operare nei mercati finanziari. Non sono inoltre fornite o supportate da TradingView. Maggiori dettagli nelle Condizioni d'uso.