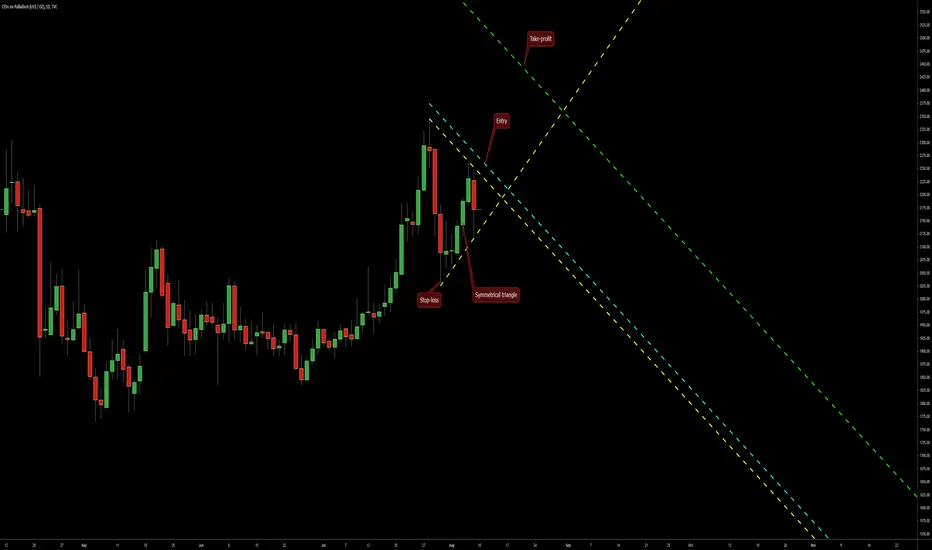
A symmetrical triangle formed on the daily chart of Palladium and now offers an opportunity to trade a bullish breakout setup. The triangle's borders are marked with the yellow lines. The potential entry level is shown with the cyan line. The potential take-profit level is where the green line is. Stop-loss can be set to the low of the triangle's base - at 2024.84.
Declinazione di responsabilità
Le informazioni ed i contenuti pubblicati non costituiscono in alcun modo una sollecitazione ad investire o ad operare nei mercati finanziari. Non sono inoltre fornite o supportate da TradingView. Maggiori dettagli nelle Condizioni d'uso.
Declinazione di responsabilità
Le informazioni ed i contenuti pubblicati non costituiscono in alcun modo una sollecitazione ad investire o ad operare nei mercati finanziari. Non sono inoltre fornite o supportate da TradingView. Maggiori dettagli nelle Condizioni d'uso.