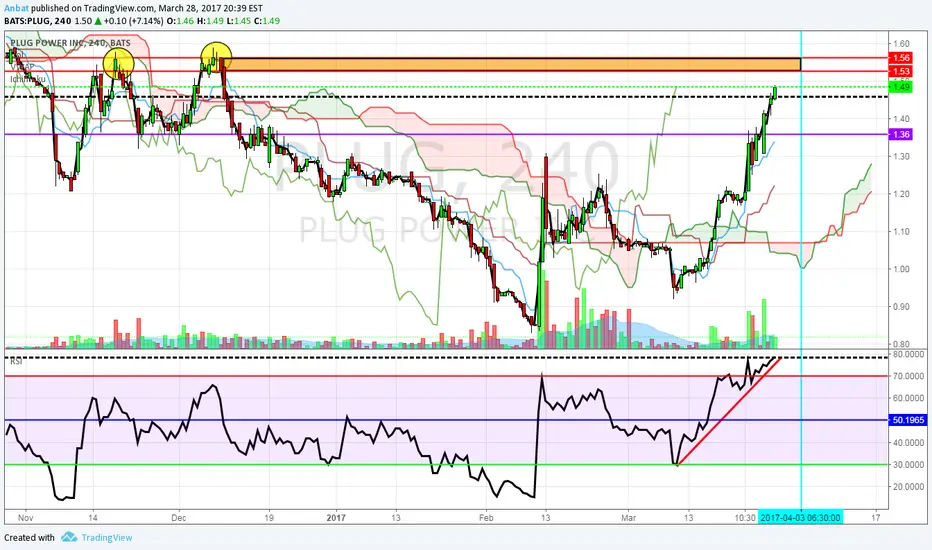
From 4 hour chart of PLUG- tomorrow's trading will initially go up to in between $1.53 to $1.56, then look LEFT on chart. This is a resistance area since 11/2016 (November). On lower either intra daily or 1 mn time frames, will be going long or with TREND beginning of trading, but when price reversal zone noted above (orange area on chart) is violated by PA & RSI indicator below (red line) is broken, will be looking for bears/sell or put trades until support level of $1.36 (purple line).
This is my opinion, on tomorrow's trading from my research and looking at big to small picture. I used this 4 hr chart related to showing resistance to left of current price action. Trade at your own risk & understand support and resistance levels. Price action is king & using your eyes/brain.
This is my opinion, on tomorrow's trading from my research and looking at big to small picture. I used this 4 hr chart related to showing resistance to left of current price action. Trade at your own risk & understand support and resistance levels. Price action is king & using your eyes/brain.
Declinazione di responsabilità
Le informazioni ed i contenuti pubblicati non costituiscono in alcun modo una sollecitazione ad investire o ad operare nei mercati finanziari. Non sono inoltre fornite o supportate da TradingView. Maggiori dettagli nelle Condizioni d'uso.
Declinazione di responsabilità
Le informazioni ed i contenuti pubblicati non costituiscono in alcun modo una sollecitazione ad investire o ad operare nei mercati finanziari. Non sono inoltre fornite o supportate da TradingView. Maggiori dettagli nelle Condizioni d'uso.