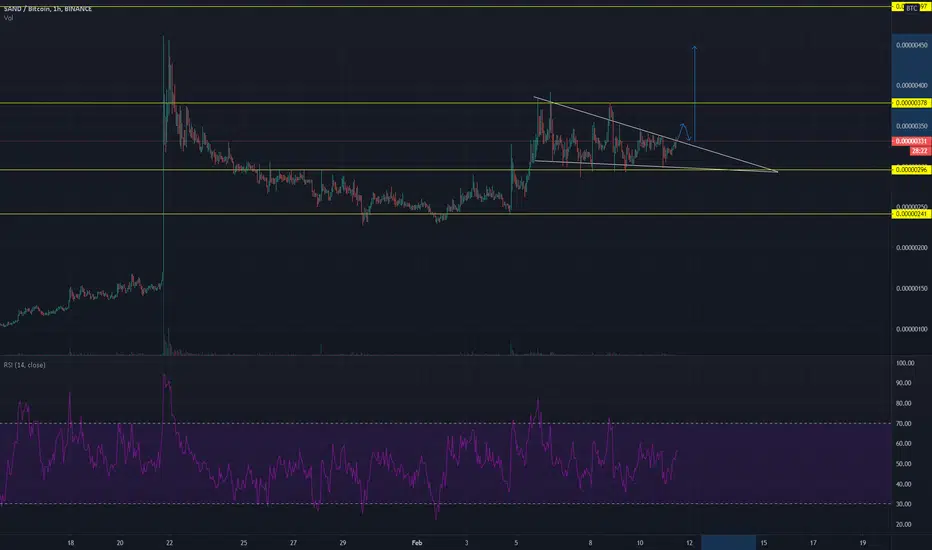
SAND/BTC on the 1hr chart is currently in a descending triangle and is holding strong at the 300 support level.
Waiting on the break of the triangle to retest and could be looking a some pretty good gains
Waiting on the break of the triangle to retest and could be looking a some pretty good gains
Declinazione di responsabilità
Le informazioni ed i contenuti pubblicati non costituiscono in alcun modo una sollecitazione ad investire o ad operare nei mercati finanziari. Non sono inoltre fornite o supportate da TradingView. Maggiori dettagli nelle Condizioni d'uso.
Declinazione di responsabilità
Le informazioni ed i contenuti pubblicati non costituiscono in alcun modo una sollecitazione ad investire o ad operare nei mercati finanziari. Non sono inoltre fornite o supportate da TradingView. Maggiori dettagli nelle Condizioni d'uso.
