Hello traders 🐺 .
this is update for my last idea about the SAND , and in this idea I want to talk about the possible price targets for the SAND .
1_pattern :

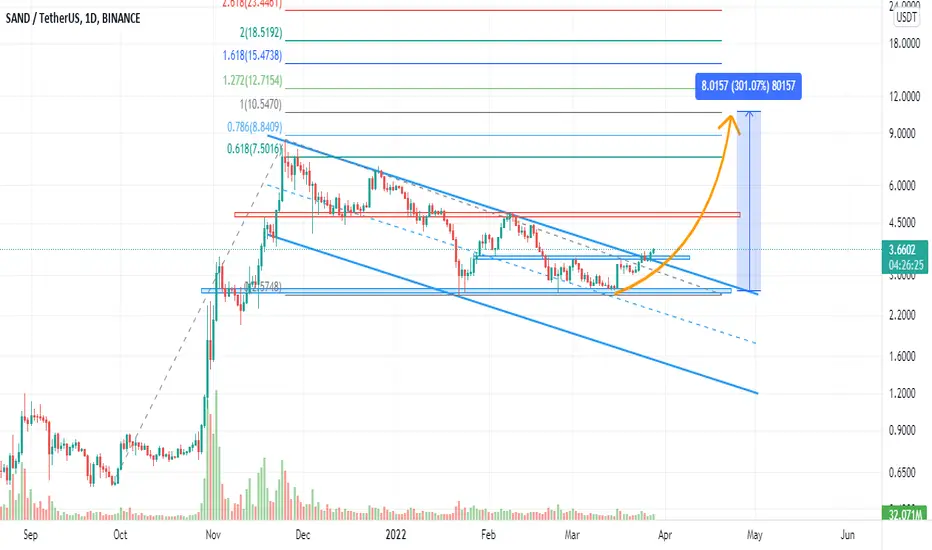
in the chart above you can see a very clear flag pattern , and as you know the flag pattern is the trend continuation pattern which means that they intend to break in the favor of the trend , in this case the overall trend is bullish so the next move could be a bullish move and the chance of it is higher than 60% .
2_EMA Ribbon :

in the daily chart we can see that the EMA Ribbon is flipping bullish and this is a very good sign for the SAND , also we can see that the price is breaking above the channel , and in my opinion after the retest of the channel and EMA Ribbon we could expect a bullish impulse for the SAND .
3_TSI and RSI :

in the RSI value we had a bullish divergence and this move is because of that divergence that we had on the RSI value .
in the other side we can see that the TSI is breaking above the zero line and we could expect this as a bullish signal .
conclusion : with above information I can say that the SAND is breaking above the flag pattern and after the retest of the channel and the EMA Ribbon we could expect a nice bullish impulse for SAND , and also TSI and RSI is also bullish so the overall view of the SAND is bullish .
price targets :

I like to use measure the price targets by using the Fibonacci tools , so as you can see in the chart above , the possible price target for the SAND is around 1.0 Fibonacci level because other name of the FLAG pattern is AB=CD pattern so the technical target is around 1.0 Fibonacci level , however we must consider the other levels of the resistance for the SAND for example the first supply area is at 0.618 .
but don't forget that this is not a Financial advice and always trade based on your trading strategy ; have nice day my dear friends .
this is update for my last idea about the SAND , and in this idea I want to talk about the possible price targets for the SAND .
1_pattern :
in the chart above you can see a very clear flag pattern , and as you know the flag pattern is the trend continuation pattern which means that they intend to break in the favor of the trend , in this case the overall trend is bullish so the next move could be a bullish move and the chance of it is higher than 60% .
2_EMA Ribbon :
in the daily chart we can see that the EMA Ribbon is flipping bullish and this is a very good sign for the SAND , also we can see that the price is breaking above the channel , and in my opinion after the retest of the channel and EMA Ribbon we could expect a bullish impulse for the SAND .
3_TSI and RSI :
in the RSI value we had a bullish divergence and this move is because of that divergence that we had on the RSI value .
in the other side we can see that the TSI is breaking above the zero line and we could expect this as a bullish signal .
conclusion : with above information I can say that the SAND is breaking above the flag pattern and after the retest of the channel and the EMA Ribbon we could expect a nice bullish impulse for SAND , and also TSI and RSI is also bullish so the overall view of the SAND is bullish .
price targets :
I like to use measure the price targets by using the Fibonacci tools , so as you can see in the chart above , the possible price target for the SAND is around 1.0 Fibonacci level because other name of the FLAG pattern is AB=CD pattern so the technical target is around 1.0 Fibonacci level , however we must consider the other levels of the resistance for the SAND for example the first supply area is at 0.618 .
but don't forget that this is not a Financial advice and always trade based on your trading strategy ; have nice day my dear friends .
_____________________________________
🐺 Discipline is rarely enjoyable ,
But almost always profitable 🐺
TElEGRAM CHANNEL : t.me/KIU_COIN
_____________________________________
🐺 Discipline is rarely enjoyable ,
But almost always profitable 🐺
TElEGRAM CHANNEL : t.me/KIU_COIN
_____________________________________
Pubblicazioni correlate
Declinazione di responsabilità
Le informazioni ed i contenuti pubblicati non costituiscono in alcun modo una sollecitazione ad investire o ad operare nei mercati finanziari. Non sono inoltre fornite o supportate da TradingView. Maggiori dettagli nelle Condizioni d'uso.
_____________________________________
🐺 Discipline is rarely enjoyable ,
But almost always profitable 🐺
TElEGRAM CHANNEL : t.me/KIU_COIN
_____________________________________
🐺 Discipline is rarely enjoyable ,
But almost always profitable 🐺
TElEGRAM CHANNEL : t.me/KIU_COIN
_____________________________________
Pubblicazioni correlate
Declinazione di responsabilità
Le informazioni ed i contenuti pubblicati non costituiscono in alcun modo una sollecitazione ad investire o ad operare nei mercati finanziari. Non sono inoltre fornite o supportate da TradingView. Maggiori dettagli nelle Condizioni d'uso.
