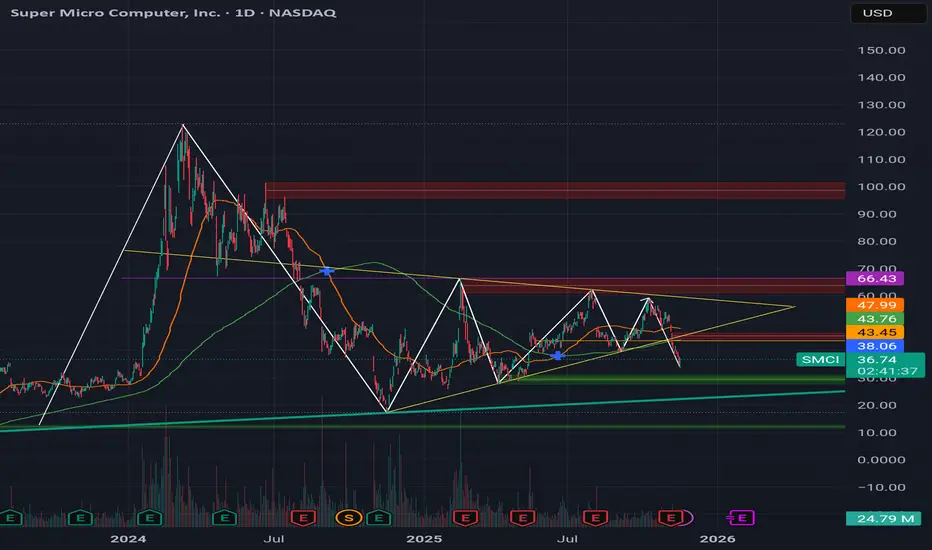
I see a HUGE symmetrical triangle pattern with a HUGE fakeout on a daily chart.
Past few years, SMCI has always been at its yearly lowest in November time frame, and then it shoots up towards the end of year. Check it out yourself.
Recent A.I. bubble fears have given us amazing discount (the huge fakeout).
I know SMCI almost always does not act accordingly to conventional analysis we anticipate and this time is no exception. If this heads lower again,- perhaps down to sub-$30(?), I am going to fully commit for Christmas present.
My target is $66 by the end of the year :)
Good luck out there, everyone.
Declinazione di responsabilità
Le informazioni e le pubblicazioni non sono intese come, e non costituiscono, consulenza o raccomandazioni finanziarie, di investimento, di trading o di altro tipo fornite o approvate da TradingView. Per ulteriori informazioni, consultare i Termini di utilizzo.
Declinazione di responsabilità
Le informazioni e le pubblicazioni non sono intese come, e non costituiscono, consulenza o raccomandazioni finanziarie, di investimento, di trading o di altro tipo fornite o approvate da TradingView. Per ulteriori informazioni, consultare i Termini di utilizzo.