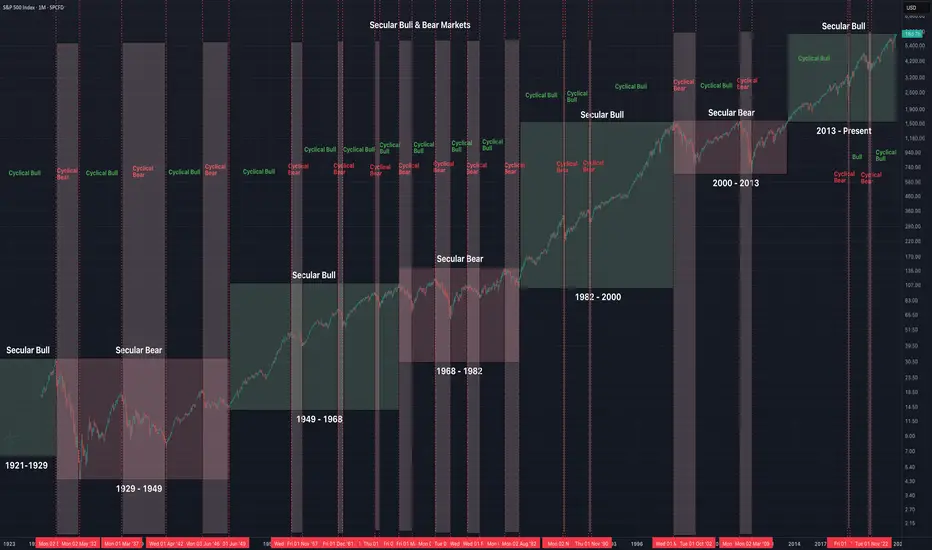
Secular vs. Cyclical Bull & Bear Markets (S&P 500, 1921–Present)
Secular Market Cycles (long-term)
Secular Bull:
1921–1929
1949–1968
1982–2000
2013–Present
Secular Bear:
1929–1949
1968–1982
2000–2013
Cyclical Market Cycles (shorter-term swings inside secular trends)
Cyclical Bears: 1929–1932, 1937–1942, 1946–1949, 1956–1957, 1961–1962, 1966, 1968–1970, 1973–1974, 1976–1978, 1980–1982, 1987, 1990, 2000–2002, 2007–2009, 2020 (COVID), 2022.
Cyclical Bulls: 1932–1937, 1942–1946, 1949–1956, 1957–1961, 1962–1966, 1966–1968, 1970–1973, 1974–1976, 1978–1980, 1982–1987, 1987–1990, 1990–2000, 2002–2007, 2009–2020, 2020–2022, 2022–Present.
Key Takeaways
Secular Bulls tend to last ~13–15 years on average, delivering powerful long-term gains with multiple smaller cyclical corrections along the way.
Secular Bears last ~13–16 years, usually defined by sideways price action with sharp rallies and deep drawdowns, leaving investors flat or negative after inflation.
Cyclical Bulls average ~4–5 years, while Cyclical Bears average ~1–2 years.
The current secular bull began in 2013 after breaking out of the 2000–2013 range.
Declinazione di responsabilità
Le informazioni ed i contenuti pubblicati non costituiscono in alcun modo una sollecitazione ad investire o ad operare nei mercati finanziari. Non sono inoltre fornite o supportate da TradingView. Maggiori dettagli nelle Condizioni d'uso.
Declinazione di responsabilità
Le informazioni ed i contenuti pubblicati non costituiscono in alcun modo una sollecitazione ad investire o ad operare nei mercati finanziari. Non sono inoltre fornite o supportate da TradingView. Maggiori dettagli nelle Condizioni d'uso.