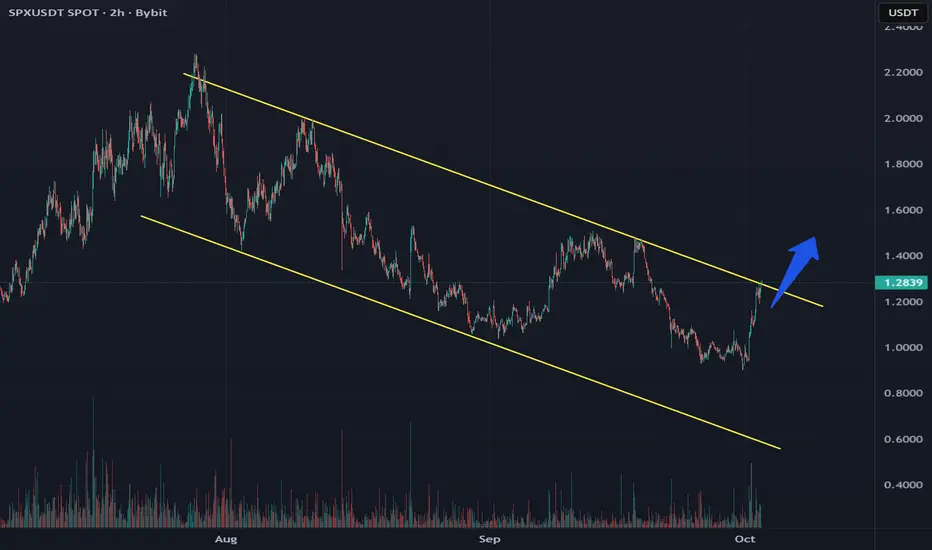
The SPX is moving within the boundaries of a bullish flag on the global timeframe
The price is attempting to break through the upper boundary of the pattern. If the price breaks through, the pattern predicts an upward price movement
Current price: $1.2429
If the price breaks through, the pattern predicts a price move to $1.3740 and above
Also, if the price fails to hold after breaking through the upper boundary, a downward rebound to 1.0118 and below is possible
More detailed analysis, additional charts, and key levels to watch are available on our site
Declinazione di responsabilità
Le informazioni e le pubblicazioni non sono intese come, e non costituiscono, consulenza o raccomandazioni finanziarie, di investimento, di trading o di altro tipo fornite o approvate da TradingView. Per ulteriori informazioni, consultare i Termini di utilizzo.
Declinazione di responsabilità
Le informazioni e le pubblicazioni non sono intese come, e non costituiscono, consulenza o raccomandazioni finanziarie, di investimento, di trading o di altro tipo fornite o approvate da TradingView. Per ulteriori informazioni, consultare i Termini di utilizzo.