/ES (SP500 fut.) has dropped like a stone in the deep sea over night (currently at time of writing ~1,5%).
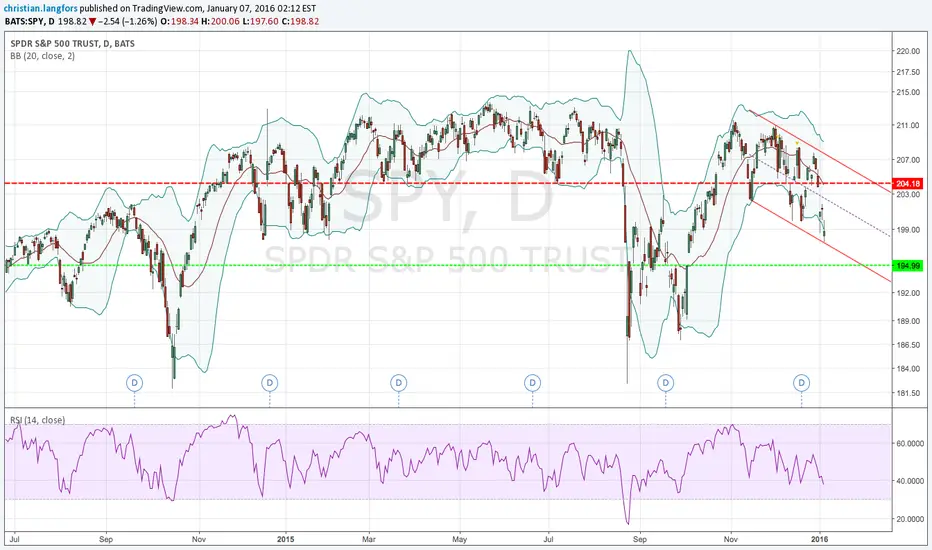
SPY closed already yesterday below lower Bollinger Bands on the daily chart and if the market opens & closes at another -1,5%, we are way below the lower Bollinger Bands.
By looking at the historical SPY charts, I'd say there is quite good odds for another blow off selling event, leading to a strong rebound. IF there will be such an event, it is obviously impossible to say from where it will/could rebound but personally I will look what happens when RSI(14) get lower to that 30-level.
Nothing in the price action in the SPY daily chart wants me to go long. ....and perhaps that is the best bullish sign there is ;-)
Pubblicazioni correlate
Declinazione di responsabilità
Le informazioni ed i contenuti pubblicati non costituiscono in alcun modo una sollecitazione ad investire o ad operare nei mercati finanziari. Non sono inoltre fornite o supportate da TradingView. Maggiori dettagli nelle Condizioni d'uso.
Pubblicazioni correlate
Declinazione di responsabilità
Le informazioni ed i contenuti pubblicati non costituiscono in alcun modo una sollecitazione ad investire o ad operare nei mercati finanziari. Non sono inoltre fornite o supportate da TradingView. Maggiori dettagli nelle Condizioni d'uso.