Based on the images you've uploaded, here's a detailed analysis and summary of the SWIGGY LTD chart:
---
### **Chart Pattern and Technical Overview:**
* **Falling Channel:**
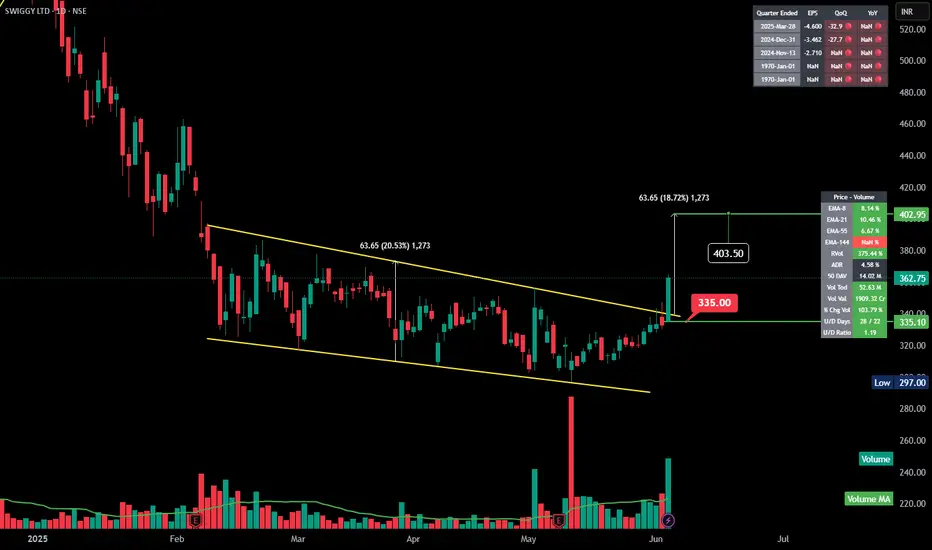
The price action was contained in a downward-sloping channel, marked by two yellow trendlines (upper and lower boundaries).
This pattern reflects a period of consolidation within a larger downtrend.
* **Breakout:**
Recently, the price has broken out of this descending channel, closing above the upper trendline around the 335.00 level.
Such a breakout is typically considered bullish, suggesting a potential trend reversal or at least a short-term move to the upside.
* **Volume Confirmation:**
A significant increase in volume accompanied the breakout, confirming the strength of this move.
High volume breakouts generally have a higher probability of sustaining.
* **Price Targets & Measurements:**
* The breakout target is projected based on the height of the channel (approx. 63.65 points).
* Measured breakout target:
$\text{Breakout level (335.00)} + \text{Channel height (63.65)} = 403.50$.
* Current price: 362.75.
* Immediate resistance zone near 403.50.
---
* **Volume:**
* Today’s volume (52.63M) is above the 50-day average (14.02M).
* This indicates strong interest and participation by traders.
---
### **Key Levels:**
✅ Support: **335.00**
✅ Resistance: **403.50**
✅ Low: **297.00**
---
### **Conclusion & Implication:**
The breakout from the falling channel with strong volume suggests a potential bullish continuation towards 403.50, as long as 335.00 holds as support. Watch for further volume spikes and price action near the target zone to determine sustainability.
---
---
### **Chart Pattern and Technical Overview:**
* **Falling Channel:**
The price action was contained in a downward-sloping channel, marked by two yellow trendlines (upper and lower boundaries).
This pattern reflects a period of consolidation within a larger downtrend.
* **Breakout:**
Recently, the price has broken out of this descending channel, closing above the upper trendline around the 335.00 level.
Such a breakout is typically considered bullish, suggesting a potential trend reversal or at least a short-term move to the upside.
* **Volume Confirmation:**
A significant increase in volume accompanied the breakout, confirming the strength of this move.
High volume breakouts generally have a higher probability of sustaining.
* **Price Targets & Measurements:**
* The breakout target is projected based on the height of the channel (approx. 63.65 points).
* Measured breakout target:
$\text{Breakout level (335.00)} + \text{Channel height (63.65)} = 403.50$.
* Current price: 362.75.
* Immediate resistance zone near 403.50.
---
* **Volume:**
* Today’s volume (52.63M) is above the 50-day average (14.02M).
* This indicates strong interest and participation by traders.
---
### **Key Levels:**
✅ Support: **335.00**
✅ Resistance: **403.50**
✅ Low: **297.00**
---
### **Conclusion & Implication:**
The breakout from the falling channel with strong volume suggests a potential bullish continuation towards 403.50, as long as 335.00 holds as support. Watch for further volume spikes and price action near the target zone to determine sustainability.
---
Declinazione di responsabilità
Le informazioni e le pubblicazioni non sono intese come, e non costituiscono, consulenza o raccomandazioni finanziarie, di investimento, di trading o di altro tipo fornite o approvate da TradingView. Per ulteriori informazioni, consultare i Termini di utilizzo.
Declinazione di responsabilità
Le informazioni e le pubblicazioni non sono intese come, e non costituiscono, consulenza o raccomandazioni finanziarie, di investimento, di trading o di altro tipo fornite o approvate da TradingView. Per ulteriori informazioni, consultare i Termini di utilizzo.