1️⃣ Trend & Demand Zones
HTF (Higher Time Frame) – Yearly, Half-Yearly, and Quarterly are all UP.
Strong support zones: 2,050 – 4,453 average demand.
MTF (Medium Time Frame) – Monthly, Weekly, Daily also UP.
Support zones around 5,626 – 7,374.
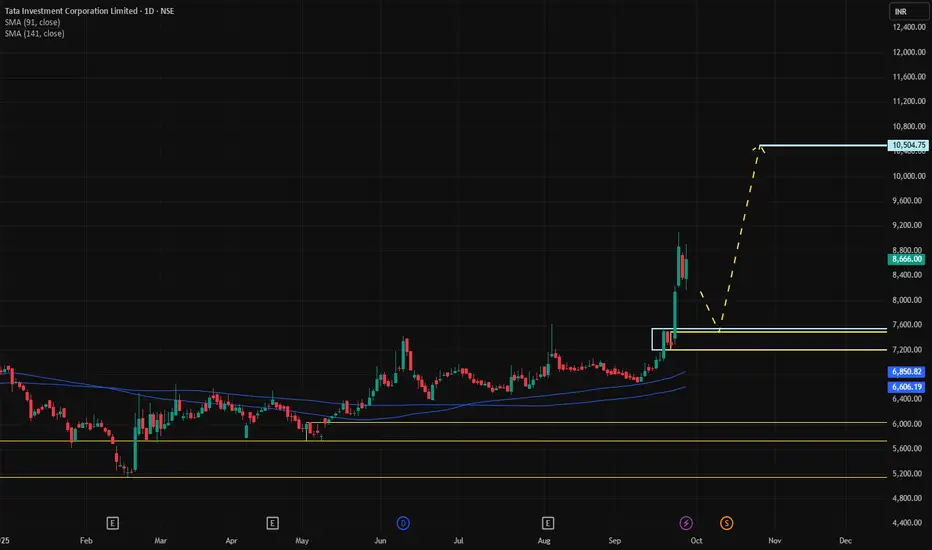
ITF (Intraday/Lower Time Frame) – All UP around 7,276–7,344.
📌 Overall: Uptrend across all time frames. Demand zones clustered between 7,200–7,400, making 7,202 a logical stop-loss.
2️⃣ Trade Plan Key Numbers
Parameter Value
Entry 7,545
Stop-loss (SL) 7,202
Target 10,419
Risk per share 343 (5%)
Reward per share 2,874 (38%)
Risk-Reward Ratio (RRR) ~8.38
Meaning: For every ₹1 risked, potential gain ~₹8.38.
3️⃣ Capital Allocation
Quantity planned: 500 shares
Total buy value: ₹3,772,500
Margin/MTF: 50% (₹1,886,250 actual capital used)
4️⃣ Brokerage & Taxes
Brokerage & other taxes (Buy + Sell): 0.49%
Brokerage Value: ₹18,492
5️⃣ Profit / Loss Scenarios
Scenario P/L (₹)
Profit if hits target +1,437,000 (Gross) → 1,418,508 (Net)
Loss if hits SL -171,500 (Gross) → 189,992 (Net)
Net RR (real): ~7.47.
6️⃣ Real ROI
MTF Capital: ₹1,886,250
Interest per annum: 9.69%
Total interest (4 months): ~₹60,091
Net Profit after interest: ~₹1,358,417
Real ROI in 4 months: ~72%
7️⃣ Key Takeaways
Strong uptrend on all time frames – aligns with a bullish plan.
Stop-loss at 7,202 is just below the critical demand zone, limiting downside risk.
Reward-to-risk ratio >7 is excellent.
ROI of 72% in 4 months shows attractive leverage with MTF but depends on the move to 10,419.
HTF (Higher Time Frame) – Yearly, Half-Yearly, and Quarterly are all UP.
Strong support zones: 2,050 – 4,453 average demand.
MTF (Medium Time Frame) – Monthly, Weekly, Daily also UP.
Support zones around 5,626 – 7,374.
ITF (Intraday/Lower Time Frame) – All UP around 7,276–7,344.
📌 Overall: Uptrend across all time frames. Demand zones clustered between 7,200–7,400, making 7,202 a logical stop-loss.
2️⃣ Trade Plan Key Numbers
Parameter Value
Entry 7,545
Stop-loss (SL) 7,202
Target 10,419
Risk per share 343 (5%)
Reward per share 2,874 (38%)
Risk-Reward Ratio (RRR) ~8.38
Meaning: For every ₹1 risked, potential gain ~₹8.38.
3️⃣ Capital Allocation
Quantity planned: 500 shares
Total buy value: ₹3,772,500
Margin/MTF: 50% (₹1,886,250 actual capital used)
4️⃣ Brokerage & Taxes
Brokerage & other taxes (Buy + Sell): 0.49%
Brokerage Value: ₹18,492
5️⃣ Profit / Loss Scenarios
Scenario P/L (₹)
Profit if hits target +1,437,000 (Gross) → 1,418,508 (Net)
Loss if hits SL -171,500 (Gross) → 189,992 (Net)
Net RR (real): ~7.47.
6️⃣ Real ROI
MTF Capital: ₹1,886,250
Interest per annum: 9.69%
Total interest (4 months): ~₹60,091
Net Profit after interest: ~₹1,358,417
Real ROI in 4 months: ~72%
7️⃣ Key Takeaways
Strong uptrend on all time frames – aligns with a bullish plan.
Stop-loss at 7,202 is just below the critical demand zone, limiting downside risk.
Reward-to-risk ratio >7 is excellent.
ROI of 72% in 4 months shows attractive leverage with MTF but depends on the move to 10,419.
Declinazione di responsabilità
Le informazioni ed i contenuti pubblicati non costituiscono in alcun modo una sollecitazione ad investire o ad operare nei mercati finanziari. Non sono inoltre fornite o supportate da TradingView. Maggiori dettagli nelle Condizioni d'uso.
Declinazione di responsabilità
Le informazioni ed i contenuti pubblicati non costituiscono in alcun modo una sollecitazione ad investire o ad operare nei mercati finanziari. Non sono inoltre fornite o supportate da TradingView. Maggiori dettagli nelle Condizioni d'uso.