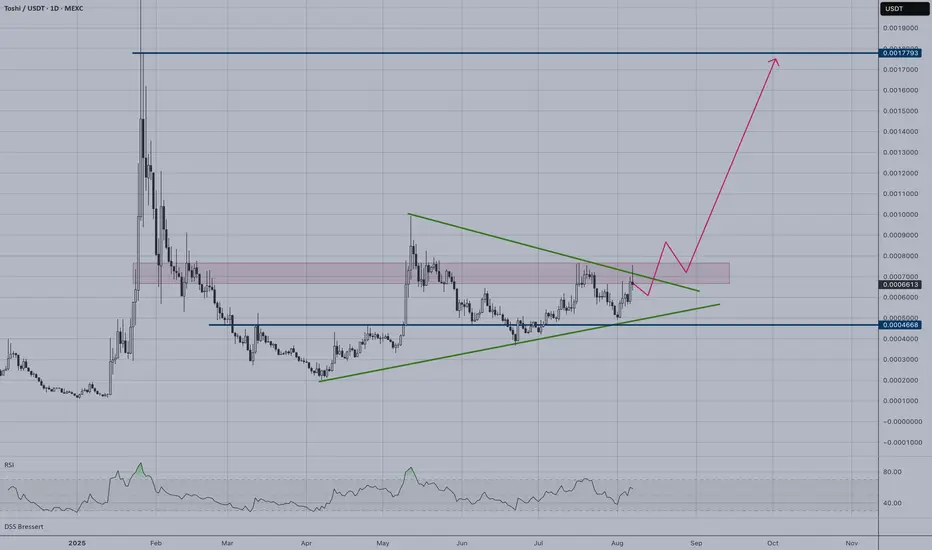
TOSHI is forming a classic symmetrical triangle pattern on the daily timeframe, indicating consolidation before a potential major move. The price has been compressed between converging support and resistance lines for several months.
Key Technical Observations:
Triangle pattern nearing apex completion
RSI shows neutral momentum around 50 level
Volume compression typical of triangle formations
Breakout Scenarios:
Bullish Breakout:
Target: 0.0017793 USDT (upper resistance zone)
Entry: Above triangle resistance with volume confirmation
Bearish Breakdown:
Target: 0.0004668 USDT (lower support zone)
Stop-loss consideration above breakdown level
Risk Management:
The triangle is in its final stages, making this a high-probability setup. However, false breakouts are common, so waiting for volume confirmation and a clean break of either trendline is crucial. The projected path suggests bullish bias, but traders should prepare for movement in either direction.
Find top crypto tokens with sector indices, AI-powered sentiment analysis & news summaries.
tokenradar.ai/tv
tokenradar.ai/tv
Declinazione di responsabilità
Le informazioni ed i contenuti pubblicati non costituiscono in alcun modo una sollecitazione ad investire o ad operare nei mercati finanziari. Non sono inoltre fornite o supportate da TradingView. Maggiori dettagli nelle Condizioni d'uso.
