Here’s a **technical analysis summary** for TRENT Ltd (NSE: TRENT) based on the chart you provided:
---
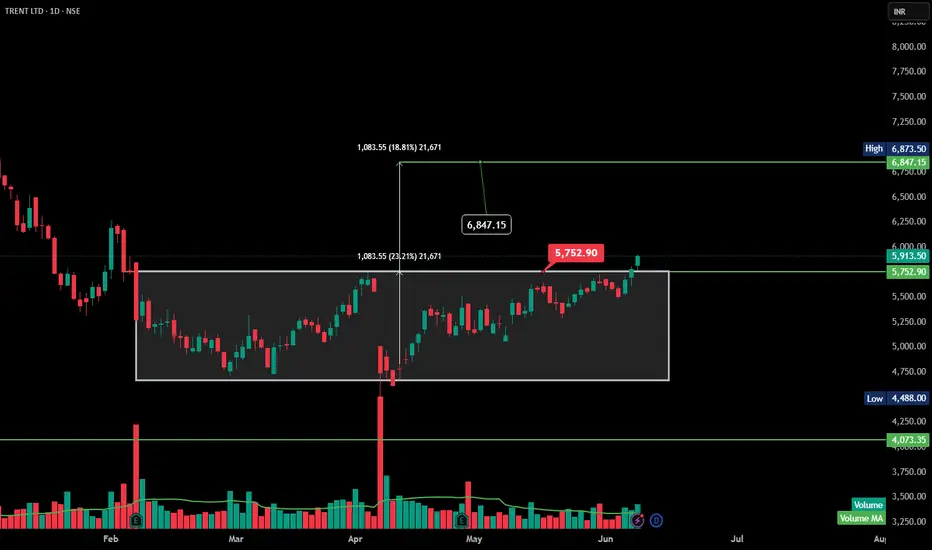
🔍 **Pattern Observed:**
The chart highlights a **rectangle range breakout** or a **horizontal consolidation breakout**. Price was consolidating between \~₹4,670 and ₹5,750 levels for several weeks and has now broken out above ₹5,750, confirming the breakout.
---
🔹 **Key Levels:**
* **Breakout zone:** ₹5,750
* **Current price:** \~₹5,913.50
* **Next resistance/target:** Measured move target around ₹6,847–₹6,900 based on the height of the rectangle (₹1,083.55 added to the breakout point).
* **Support:** ₹5,750–₹5,600 zone.
---
🔹 **Volume is missing during breakout.
---
🔍 **Pattern Observed:**
The chart highlights a **rectangle range breakout** or a **horizontal consolidation breakout**. Price was consolidating between \~₹4,670 and ₹5,750 levels for several weeks and has now broken out above ₹5,750, confirming the breakout.
---
🔹 **Key Levels:**
* **Breakout zone:** ₹5,750
* **Current price:** \~₹5,913.50
* **Next resistance/target:** Measured move target around ₹6,847–₹6,900 based on the height of the rectangle (₹1,083.55 added to the breakout point).
* **Support:** ₹5,750–₹5,600 zone.
---
🔹 **Volume is missing during breakout.
Declinazione di responsabilità
Le informazioni e le pubblicazioni non sono intese come, e non costituiscono, consulenza o raccomandazioni finanziarie, di investimento, di trading o di altro tipo fornite o approvate da TradingView. Per ulteriori informazioni, consultare i Termini di utilizzo.
Declinazione di responsabilità
Le informazioni e le pubblicazioni non sono intese come, e non costituiscono, consulenza o raccomandazioni finanziarie, di investimento, di trading o di altro tipo fornite o approvate da TradingView. Per ulteriori informazioni, consultare i Termini di utilizzo.