Hello, Professor
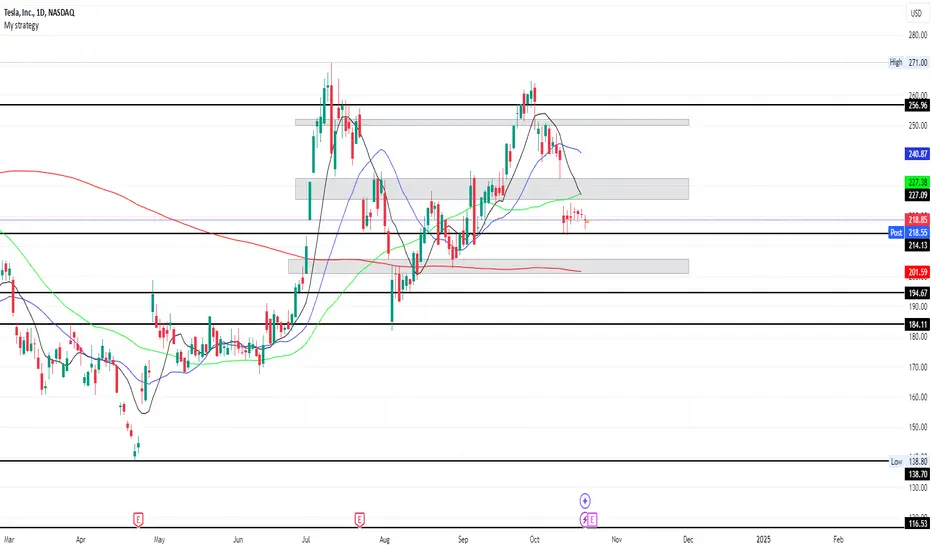
The follow is my current TSLA chart, i started with the levels on the monthly to the daily (black horizontal lines). The grey rectangles are the zones using the most recent TSLA data using the Daily Chart. It probably looks terrible to you, but i am very thankful for you looking at this. I want to learn to fish brother, not just given fish.
The follow is my current TSLA chart, i started with the levels on the monthly to the daily (black horizontal lines). The grey rectangles are the zones using the most recent TSLA data using the Daily Chart. It probably looks terrible to you, but i am very thankful for you looking at this. I want to learn to fish brother, not just given fish.
Declinazione di responsabilità
Le informazioni ed i contenuti pubblicati non costituiscono in alcun modo una sollecitazione ad investire o ad operare nei mercati finanziari. Non sono inoltre fornite o supportate da TradingView. Maggiori dettagli nelle Condizioni d'uso.
Declinazione di responsabilità
Le informazioni ed i contenuti pubblicati non costituiscono in alcun modo una sollecitazione ad investire o ad operare nei mercati finanziari. Non sono inoltre fornite o supportate da TradingView. Maggiori dettagli nelle Condizioni d'uso.