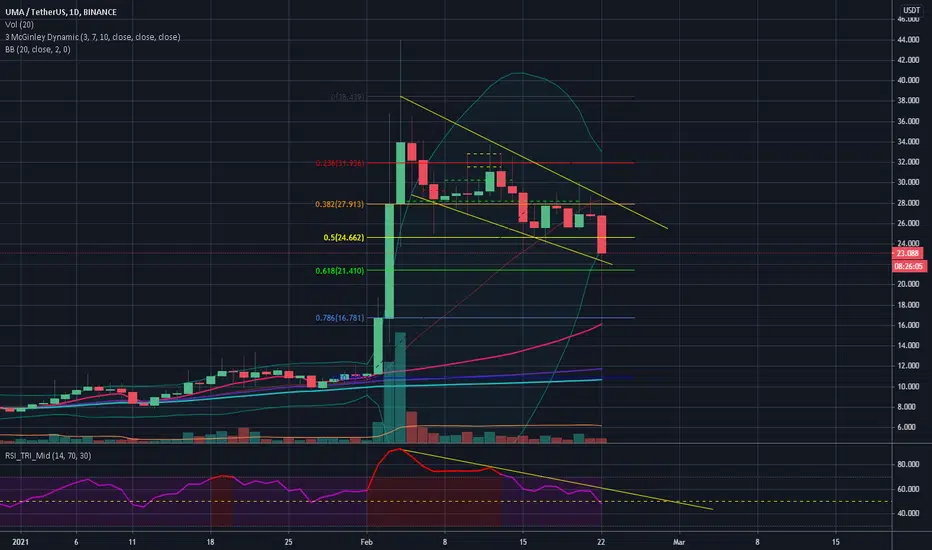
So, I started with bull flag, than a triangle, then a falling wedge and now, today's BTC/market dump changed UMA's pattern into a bigger wedge. Latest breakout is now a LH and we're within 0.5 and 0.618 Fib lines. In my personal experience most of reversal happens in this zone (as I've said in the past I expected a reversal on the falling wedge at 0.5 line. Off course that TA was done according with the former wedge.
Today I've read a tweet of a trader from whom I've much respect and he said most of reversals (in general) happen between 0.618 and 0.786. I personally observed this happening in the precedent zone, I hope I'm right in this case despite him being much better than me in this field.
BB suggests it could revers even now but I took a look at the bigger picture (weekly chart) and I won't rule out a possible price decrease even this week because this current week started today and there's a red candle that could remains red.
Let's see how this thing evolves, if you didn't sell before you should do it now for sure.
Remember my first reasonable target for this is 45$
Nota
for the record, at 1h timeframe price did a V bounce on lower wedge's supporti.imgur.com/XXNKKmC.jpg
Nota
Everything is going down so, now more than ever, don't sell at loss!Nota
UMA is back on track and over EMA 200, so my previous TA is valid again!I do TA because I like and it seems at least 70% of my calls usually turn out to be true. If you wanna support me please donate some tradingview coin or check "about me"
Declinazione di responsabilità
Le informazioni ed i contenuti pubblicati non costituiscono in alcun modo una sollecitazione ad investire o ad operare nei mercati finanziari. Non sono inoltre fornite o supportate da TradingView. Maggiori dettagli nelle Condizioni d'uso.
I do TA because I like and it seems at least 70% of my calls usually turn out to be true. If you wanna support me please donate some tradingview coin or check "about me"
Declinazione di responsabilità
Le informazioni ed i contenuti pubblicati non costituiscono in alcun modo una sollecitazione ad investire o ad operare nei mercati finanziari. Non sono inoltre fornite o supportate da TradingView. Maggiori dettagli nelle Condizioni d'uso.