🔹 Chart Observations
Resistance Breakout
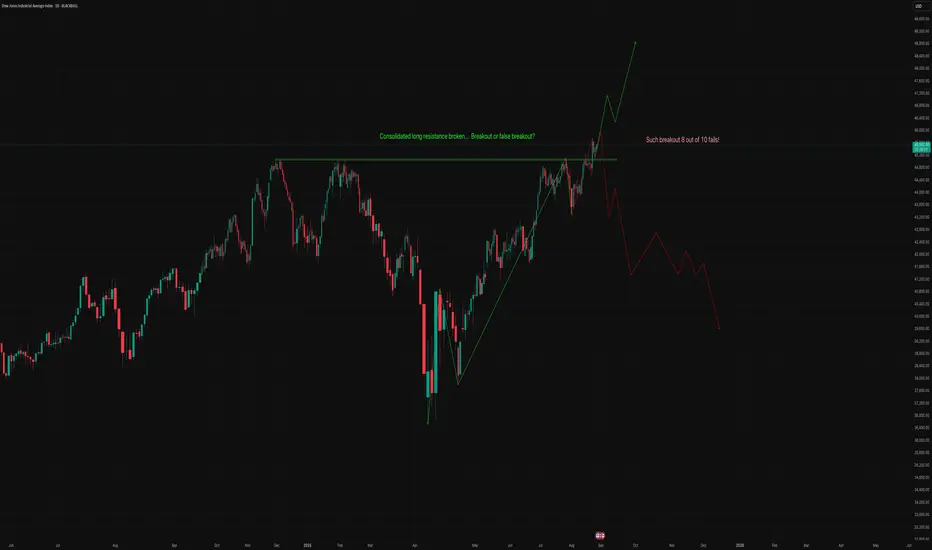
Price has broken above a long consolidation resistance (~46,000 region).
The breakout candle is strong, but history shows such moves can turn into false breakouts.
Volume / Price Action
Recent candles show strong upward momentum but also long wicks, hinting at supply near highs.
Breakouts without strong follow-up volume often fail.
Trend Structure
From April lows, the index has made a clear higher-high, higher-low structure.
This short-term uptrend is intact unless price falls below ~44,500.
Probability Factor
Your annotation (“Such breakouts 8 out of 10 fails”) is correct — historically, consolidated range breakouts in indices often retrace.
A retest of breakout zone (~45,000–45,500) is possible.
🔹 Medium-Term Scenarios
✅ Bullish Case (Green Path in Chart)
Sustains above 46,000 → momentum could extend toward 47,800 → 49,500 (ATH zones).
Requires confirmation with volume and follow-through buying.
Support at 45,000–45,500 must hold.
⚠️ Bearish Case (Red Path in Chart)
If price fails to hold 45,000, breakdown may drag index toward:
42,500 (first major demand zone).
40,000 (psychological + structural support).
A false breakout could trigger a deeper correction, especially if global risk sentiment weakens.
🔹 Medium-Term Outlook
Bias: Cautiously bullish, but watching for false breakout signs.
Key trigger levels:
Above 46,000 → bullish continuation.
Below 45,000 → correction likely toward 42,500–40,000.
🔹 Trading View
Swing Traders:
Enter only on confirmation (daily close above 46,200 with volume).
SL below 45,000.
Options Traders:
Iron condor/strangles around 45,000–47,000 range could work short term, since volatility may compress after breakout.
Medium-term investors:
Better to wait for a retest of breakout zone before adding fresh longs.
⚠️ Disclaimer: This is a technical view, not financial advice. Always combine with macro factors (US rates, Fed outlook, earnings).
Resistance Breakout
Price has broken above a long consolidation resistance (~46,000 region).
The breakout candle is strong, but history shows such moves can turn into false breakouts.
Volume / Price Action
Recent candles show strong upward momentum but also long wicks, hinting at supply near highs.
Breakouts without strong follow-up volume often fail.
Trend Structure
From April lows, the index has made a clear higher-high, higher-low structure.
This short-term uptrend is intact unless price falls below ~44,500.
Probability Factor
Your annotation (“Such breakouts 8 out of 10 fails”) is correct — historically, consolidated range breakouts in indices often retrace.
A retest of breakout zone (~45,000–45,500) is possible.
🔹 Medium-Term Scenarios
✅ Bullish Case (Green Path in Chart)
Sustains above 46,000 → momentum could extend toward 47,800 → 49,500 (ATH zones).
Requires confirmation with volume and follow-through buying.
Support at 45,000–45,500 must hold.
⚠️ Bearish Case (Red Path in Chart)
If price fails to hold 45,000, breakdown may drag index toward:
42,500 (first major demand zone).
40,000 (psychological + structural support).
A false breakout could trigger a deeper correction, especially if global risk sentiment weakens.
🔹 Medium-Term Outlook
Bias: Cautiously bullish, but watching for false breakout signs.
Key trigger levels:
Above 46,000 → bullish continuation.
Below 45,000 → correction likely toward 42,500–40,000.
🔹 Trading View
Swing Traders:
Enter only on confirmation (daily close above 46,200 with volume).
SL below 45,000.
Options Traders:
Iron condor/strangles around 45,000–47,000 range could work short term, since volatility may compress after breakout.
Medium-term investors:
Better to wait for a retest of breakout zone before adding fresh longs.
⚠️ Disclaimer: This is a technical view, not financial advice. Always combine with macro factors (US rates, Fed outlook, earnings).
Declinazione di responsabilità
Le informazioni e le pubblicazioni non sono intese come, e non costituiscono, consulenza o raccomandazioni finanziarie, di investimento, di trading o di altro tipo fornite o approvate da TradingView. Per ulteriori informazioni, consultare i Termini di utilizzo.
Declinazione di responsabilità
Le informazioni e le pubblicazioni non sono intese come, e non costituiscono, consulenza o raccomandazioni finanziarie, di investimento, di trading o di altro tipo fornite o approvate da TradingView. Per ulteriori informazioni, consultare i Termini di utilizzo.