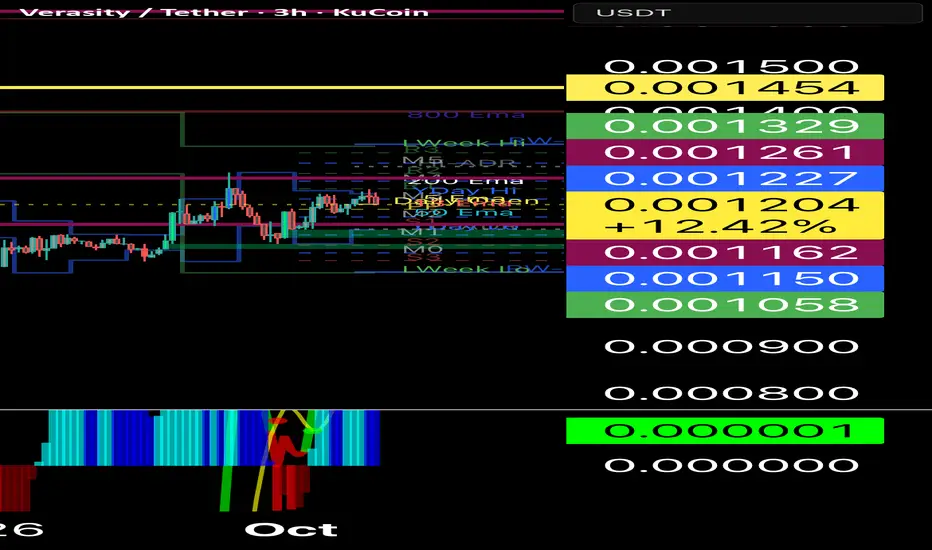
As of October 2, 2025, Verasity (
#### Overall Chart Structure and Technical Setup
On the daily and weekly timeframes (VRA/USDT and VRA/BTC pairs),
Technical indicators are mixed but leaning neutral to sell overall:
- **Oscillators (RSI, Stochastic, MACD):** Neutral, with recent sharp upside breaks in momentum indicators suggesting early bullish divergence. RSI (14) likely hovers around 40-50, not oversold but poised for a push above 50 on a breakout.
- **Moving Averages (MAs):** Strong sell signal currently, but
- **Other (CCI, PPO, Bull/Bear Power):** Show buy signals and hidden bullish divergences, supporting reversal potential.
The weekly chart shows a reversal candle with a bullish close, potentially ending the bearish cycle that's lasted over 1,100 days (nearly 3x the 2021 bull run duration). Against BTC,
#### Bullish Scenario
In a bullish case,
1. **Short-Term Breakout (1-4 Weeks):** Price consolidates in a demand zone around $0.0011-$0.0014, then breaks above $0.0015 (near EMA200/previous resistance). This could confirm a 5-wave Elliott impulse or harmonic completion, targeting 20-30% gains to $0.0018-$0.0020. Expect RSI to cross 60 and MACD histogram to flip positive for confirmation.
2. **Medium-Term Rally (1-3 Months):** If volume spikes and it clears $0.0020 (Fib 0.618 from recent highs), momentum could accelerate to $0.0025-$0.0035, a 100-200% move from current levels. This aligns with updated tokenomics acting as a catalyst, potentially mirroring the "surprise" upside seen in past cycles.
3. **Long-Term Bullish Wave (2025 Outlook):** Breaking $0.0082 confirms the end of the correction, targeting $0.025 (initial wave extension) or higher to $0.08 via harmonic patterns—yielding 2,000%+ upside. Optimistic forecasts see $0.0285 by year-end or even $0.0644 in a full altseason, though more conservative models cap at $0.0035 max. Risks include further unlocks (86.6 billion tokens still locked) dampening gains.
Key Levels to Watch
- **Support Levels:**
- Immediate: $0.00118 (24h low) – Critical hold for bullish invalidation.
- Major: $0.0010-$0.0012 – Multi-year bottom; breach could lead to retest of $0.0008 or lower.
- **Resistance Levels:**
- Near-Term: $0.0013-$0.0015 – Recent highs and EMA cluster; breakout here sparks short-term pump.
- Intermediate: $0.0020 – Fib resistance; clearing this opens $0.0025.
- Long-Term: $0.0082 – Key confirmation for bull market resumption.
Risks and Considerations
While the setup favors a bullish reversal if support holds,
Declinazione di responsabilità
Le informazioni ed i contenuti pubblicati non costituiscono in alcun modo una sollecitazione ad investire o ad operare nei mercati finanziari. Non sono inoltre fornite o supportate da TradingView. Maggiori dettagli nelle Condizioni d'uso.
Declinazione di responsabilità
Le informazioni ed i contenuti pubblicati non costituiscono in alcun modo una sollecitazione ad investire o ad operare nei mercati finanziari. Non sono inoltre fornite o supportate da TradingView. Maggiori dettagli nelle Condizioni d'uso.
