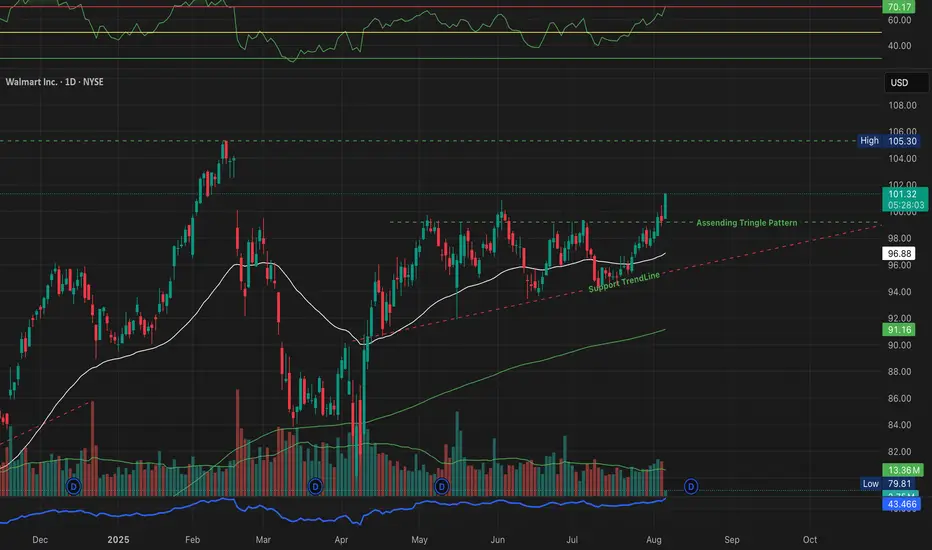
Walmart Inc. (Ticker: WMT), listed on the U.S. stock exchange (NYSE), appears to have formed a classic Ascending Triangle Pattern on the daily chart. As of August 6, 2025, the price has broken above the horizontal resistance near $100.60, closing at $101.16 with decent volume and strong bullish candles.
📈 Resistance zone: ~$100.60
📉 Support trendline: Rising since early May 2025
🔼 Breakout Level: ~$100.60 (now turned support)
📊 Volume: Breakout supported by above-average volume
💹 RSI: Currently near overbought zone (69.69), which indicates strength but also requires caution
If the price sustains above this level in the coming sessions, it could be a sign of continuation toward the next target zone of $105–106, as marked on the chart.
📊 Quick Fundamental Snapshot (2025):
Market Cap ~$400B
Revenue (TTM) ~$650B+
Net Income (TTM) ~$15B
EPS (TTM) ~$5.60
P/E Ratio ~18x
Dividend Yield ~1.5%
ROE ~18%
Walmart remains one of the strongest players in retail globally, with its recent focus on e-commerce, warehouse automation, and supply chain optimization boosting investor sentiment.
ANALYSIS BY MAYUR JAYANT TAKALIKAR -- FOR LEARNING & OBSERVATIONAL USE ONLY.
⚠️ Disclaimer
I am not a SEBI-registered advisor. This analysis is for educational and informational purposes only. Please do your own research or consult with a certified financial advisor before making any investment decisions.
Declinazione di responsabilità
Le informazioni ed i contenuti pubblicati non costituiscono in alcun modo una sollecitazione ad investire o ad operare nei mercati finanziari. Non sono inoltre fornite o supportate da TradingView. Maggiori dettagli nelle Condizioni d'uso.
Declinazione di responsabilità
Le informazioni ed i contenuti pubblicati non costituiscono in alcun modo una sollecitazione ad investire o ad operare nei mercati finanziari. Non sono inoltre fornite o supportate da TradingView. Maggiori dettagli nelle Condizioni d'uso.