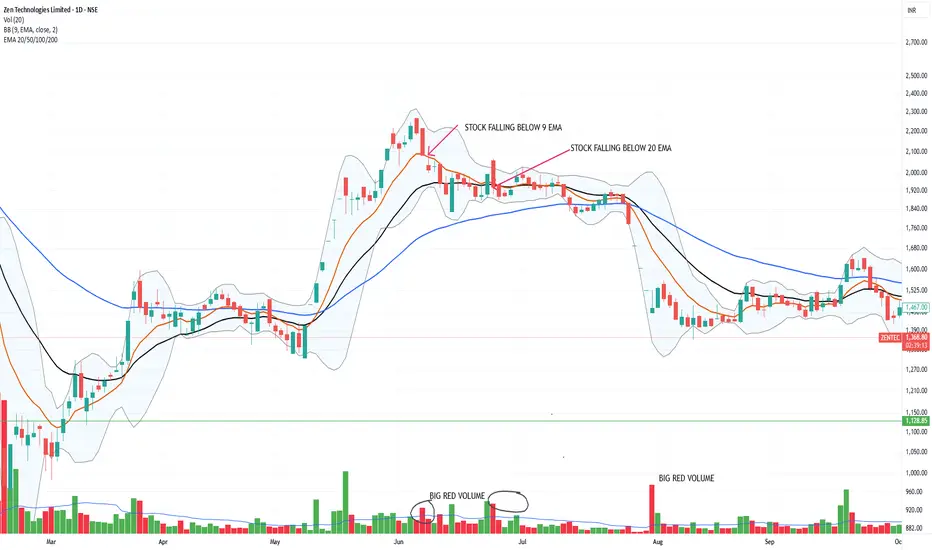
Exit strategy is just as important as entry strategy.
We can use a daily close under the EMA's to sell our position.
We can trim 25% of our position in a stock when its price close under the 9 EMA.
We can avoid fake breakdown by closely monitoring the Volume.
Either a big Red Volume Candle (Increased Selling Interest) is an indication of upcoming fall in the Price movement.
We can trim 25% of our position in a stock when its price close under the 21 EMA.
Again have a close observation on the Volume candle to confirm the weakness.
Sell full position when the price of the stock fall below 50 EMA.
Note: The above chart is for educational purpose only.
Declinazione di responsabilità
Le informazioni e le pubblicazioni non sono intese come, e non costituiscono, consulenza o raccomandazioni finanziarie, di investimento, di trading o di altro tipo fornite o approvate da TradingView. Per ulteriori informazioni, consultare i Termini di utilizzo.
Declinazione di responsabilità
Le informazioni e le pubblicazioni non sono intese come, e non costituiscono, consulenza o raccomandazioni finanziarie, di investimento, di trading o di altro tipo fornite o approvate da TradingView. Per ulteriori informazioni, consultare i Termini di utilizzo.