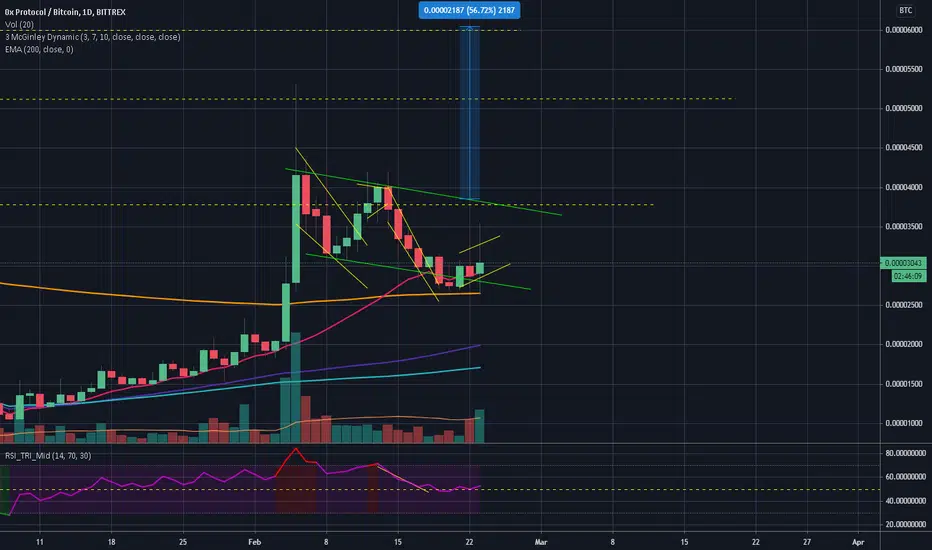
My portfolio is bleeding very badly, however the trades with BTC pairs can actually benefit from this crash. As you can see EMA 200 is below the chart (it's the same at 4h and at 1h the candles go up and down). For the moment we can assume that the trend is still bullish even because RSI is over 50%.
I'm sharing the daily chart because it's easy to see the chart's zig-zag inside the bull flag, even if the bouce upwards happened a little bit below the support I had drawn it happened and right now it seems there's an uptrend. Now, if BTC moves slowly this could help this trade, especially its price doesn't rise much.
I'm positive on this.
I do TA because I like and it seems at least 70% of my calls usually turn out to be true. If you wanna support me please donate some tradingview coin or check "about me"
Declinazione di responsabilità
Le informazioni e le pubblicazioni non sono intese come, e non costituiscono, consulenza o raccomandazioni finanziarie, di investimento, di trading o di altro tipo fornite o approvate da TradingView. Per ulteriori informazioni, consultare i Termini di utilizzo.
