BTCUSDT (1H) – Accumulo stabile in attesa di breakout!Bitcoin è scambiato stabilmente in una stretta zona di accumulo intorno a 121.800 dopo una leggera correzione all'inizio della settimana. La struttura dei prezzi mantiene ancora un trend rialzista a medio termine, con la principale zona di supporto che coincide con il limite inferiore del Kumo sul grafico H1, a indicare che gli acquirenti hanno ancora il controllo.
Secondo Ichimoku, il Kumo frontale ha iniziato a restringersi, segno che il momentum ribassista si è indebolito.
Da una prospettiva macro, il sentiment di rischio sta gradualmente migliorando dopo la ripresa del mercato azionario statunitense e il calo dei rendimenti obbligazionari. I flussi di denaro istituzionali rimangono positivi sugli ETF Bitcoin, poiché le posizioni non mostrano segni di ritiro netto.
Scenario preferito: acquisto intorno a 121.000-121.500, confermato quando il prezzo chiude sopra 122.800.
Obiettivo: 126.200-128.000
Signals

L'oro mantiene lo slancio di 4000 settimane!Il prezzo dell'oro continua a mantenere un aumento stabile del telaio di 1 ora, attenersi alla linea di tendenza principale formata dalla fine di settembre.
RSI ha mantenuto circa 60, senza segnali eccessivi, dimostrando che la forza di acquisto è ancora ben controllata. Le nuvole di ichimoku svolgono un ruolo nel supporto dinamico, il prezzo si accende costantemente dall'area del cloud, rafforzando la tendenza dell'aumento a breve termine.
Fintanto che il prezzo detiene oltre $ 3.915, il prossimo obiettivo sarà verso l'area di $ 4.000 - una forte soglia psicologica.
La psicologia del mercato è ancora inclusa all'oro quando DXY si indebolisce e prevede che Fed riduca i tassi di interesse. Se c'è un leggero adeguamento di $ 3.880 - 3.900, è un'opportunità per "riacquistare".

RIPRESA COSTANTE, OBIETTIVO VERSO 128K USDTBitcoin (BTC/USDT) su Binance continua a mantenere una struttura rialzista stabile all'interno di un cuneo ascendente, dopo aver completato una correzione tecnica alla zona di supporto di 123.500 USDT. I rialzisti hanno rapidamente ripreso l'iniziativa quando il prezzo è rimbalzato da questa zona di domanda, rompendo al contempo la linea di tendenza ribassista a breve termine, confermando il segnale di una ripresa del trend principale.
Sul grafico H1, il prezzo si sta muovendo bene in un pattern di Canale Ascendente, con la possibilità di formare altre sessioni di accumulo prima di irrompere nella zona di resistenza di 126.800-127.000 USDT.
Dal punto di vista macro, Bitcoin è ancora supportato dal ritorno del denaro istituzionale dopo che il rapporto economico statunitense ha mostrato un rallentamento dell'inflazione, rafforzando le aspettative di un imminente taglio dei tassi di interesse da parte della Fed.
👉 Con un forte slancio di ripresa sia tecnico che macro, BTC sembra "guadagnare slancio" per un nuovo breakout.

I tori dell'oro prendono il controlloCiao a tutti,
L'oro continua a seguire chiaramente la struttura del canale ascendente, formando nuovi massimi e minimi più alti. Recentemente, il prezzo ha reagito con forza ai limiti inferiori del canale, intorno a 3820 e 3840, spingendo il prezzo verso la parte superiore del canale.
Il punto cruciale ora è la zona di offerta tra 3880 e 3900. Mi aspetto che il prezzo testare questa zona a breve, con una grande possibilità che il mercato veda una rottura di questi livelli. Se la rottura viene confermata con successo, ciò rafforzerà la continuazione del trend rialzista, con obiettivi successivi tra 3950 e 3970.
Trend: Rialzista
Livelli principali:
Resistenza: 3880 – 3900 (Zona di offerta)
Prossimo obiettivo: 3950 – 3970
Se la struttura del canale rimane invariata, qualsiasi correzione al ribasso sarà un'opportunità di acquisto, poiché il trend principale è ancora rialzista.

Analisi tecnica dell’oro – È in arrivo un ritracciamento?Ciao a tutti, parliamo di XAUUSD.
In questo momento l’oro sta mostrando una dinamica chiara: il prezzo si muove in salita e sta testando il limite superiore del canale ascendente. Quest’area funziona come una resistenza dinamica e sarà decisiva per capire se i compratori hanno la forza necessaria a proseguire. Se il mercato non riuscirà a superarla, è probabile una correzione al ribasso.
Dal mio punto di vista mantengo un approccio prudente e aspetto una conferma tecnica prima di aprire una posizione short. Il livello dei 3.900 dollari rimane il mio obiettivo principale, perché rappresenta un punto coerente con la struttura attuale del mercato.
E voi come vedete la situazione? Vi aspettate un ritracciamento oppure credete che ci sarà una rottura al rialzo? Condividete la vostra analisi nei commenti.

Oro nel mirino: La correzione prepara il prossimo movimentoCiao a tutti, cosa ne pensate di XAUUSD?
Attualmente, l'oro si trova in un chiaro trend rialzista. Recentemente, il prezzo ha subito una correzione dal punto più alto di questa tendenza e ha toccato il limite inferiore del canale, dove ha incontrato un forte supporto. Questo suggerisce che gli acquirenti sono tornati nel mercato, spingendo nuovamente il prezzo verso l'alto.
Se il momentum rialzista continua, è molto probabile che il prezzo rompa il limite superiore del canale e prosegua la sua ascesa. Considerando le attuali condizioni di mercato, questo scenario appare molto plausibile.
Tuttavia, se il prezzo dovesse chiudere al di sotto del limite inferiore del canale, il trend rialzista potrebbe essere invalidato e potremmo assistere a un'inversione verso un trend ribassista. In questo caso, sarà importante rimanere vigili e monitorare eventuali correzioni a breve termine mentre il mercato si adatta.

Bitcoin continua la direzione di $ 128.000Dopo la fase di aggiustamento a metà settembre, BTC ha formato un chiaro aumento e mantenuto la struttura sulla linea di tendenza dominante. La fase forte da 110.000 USDT è supportata dalle nuvole Ichimoku e il flusso di cassa al gruppo di attività a rischio.
Attualmente, il prezzo sta accumulando la zona di resistenza di 123.000-125.000 USD - la fase di compressione prima di scoppiare. RSI fluttua intorno a 55-60, dimostrando che il mercato è ancora in aumento, non ancora nell'area di acquisto.
Scenario principale: il prezzo può essere leggermente adeguato alla linea di tendenza e continuare a dirigere l'area target di 128.000 USD nella settimana. La psicologia del mercato è rafforzata dall'aspettativa di tassi di interesse ridotti e flussi di capitali indietro.
Cosa ne pensi di BTCUSDT questa settimana?

Costante, l'oro è pronto a sfondare la prossima settimana!L'oro (XAUUSD) sul pavimento di Oanda sta mantenendo la tendenza di aumentare dopo molti revisioni di successo nella regione di supporto di $ 3.840. Il BOS (interruzione della struttura) si estende sul telaio H1 mostra che l'acquirente controlla ancora il mercato.
Lo scenario principale la prossima settimana: Xauusd può continuare a fluttuare intorno all'area di $ 3.880 - 3.890, quindi se la resistenza di $ 3,897 si interrompe, il prezzo si espanderà l'ascesa a $ 3.920 - $ 3,940. In caso di aggiustamento, $ 3.840 sono ancora un supporto importante per il mercato.
Le informazioni di base supportano anche l'oro: la pressione globale dell'inflazione è ancora esistente, il flusso di cassa è sicuro da mantenere fortemente, mentre l'USD mostra segni di rallentamento. Questo fa sì che la premessa per Xauusd mantenga un aumento nella settimana successiva.
Strategia: acquista la priorità quando il prezzo di test è di circa $ 3.870 - $ 3.880 o in attesa di rompere la resistenza (l'area dei prezzi più alta della settimana) $ 3,897. Target 3.920 - 3.940 $, oltre $ 3.960.

BTC segnala un breakout dal cuneo ascendente!Bitcoin (BTCUSDT) sull'exchange BINANCE mantiene una struttura rialzista stabile, creando continuamente massimi e minimi crescenti. Sul grafico a 3 ore, il prezzo si trova attualmente in un pattern a cuneo ascendente, mantenendosi saldamente al di sopra della trendline di supporto. Questo dimostra che gli acquirenti hanno ancora il controllo e che il trend rialzista di medio termine non è stato interrotto.
Scenario principale: BTC potrebbe continuare a oscillare intorno al range 120.000-123.000 USDT, per poi uscire dal limite superiore del cuneo e dirigersi verso livelli più alti intorno a 128.000-132.000 USDT. In caso di correzione del prezzo, il range 119.200 USDT rappresenterà una solida area di supporto per il rimbalzo del mercato.
Anche le informazioni di mercato supportano il trend rialzista: la domanda di flussi di cassa dagli ETF sulle criptovalute rimane, il sentiment del mercato è positivo in seguito ai segnali di allentamento della politica monetaria globale e la capitalizzazione delle altcoin sta aumentando all'unanimità con Bitcoin.

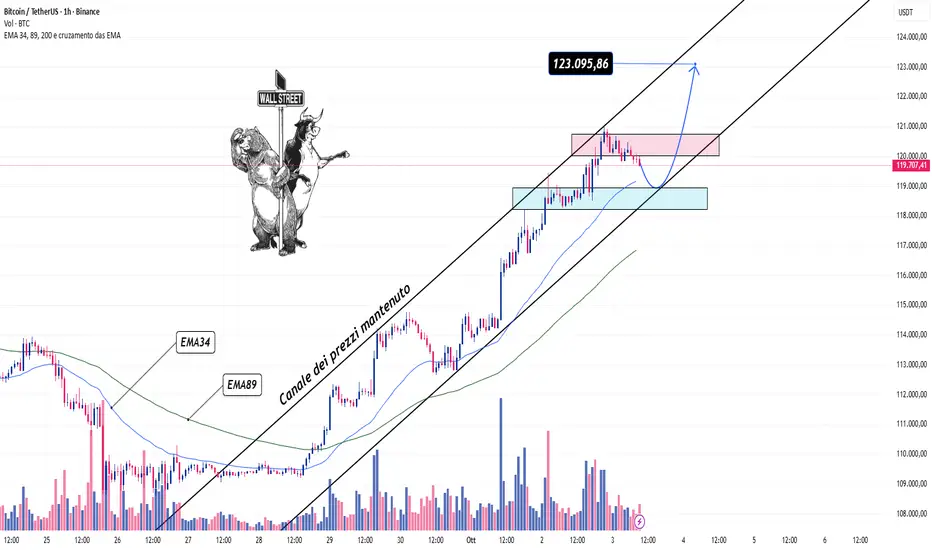
BTC/USDT – I rialzisti hanno il controllo!BTC mantiene un rialzo costante all'interno del canale dei prezzi rialzisti. Dopo una breve correzione verso la zona di supporto di 118.500 (zona verde), il prezzo è rimbalzato sopra l'EMA 34/89, confermando che il potere d'acquisto è ancora dominante. L'attuale importante zona di resistenza si trova tra 121.000 e 121.800 (zona rossa); se superata, il prossimo obiettivo è intorno a 123.000, il limite superiore del canale dei prezzi.
A livello macro, il mercato si aspetta che la Fed mantenga invariati i tassi di interesse nella prossima riunione, con il raffreddamento dei dati sul lavoro e la graduale diminuzione della pressione inflazionistica. Inoltre, la ripresa del mercato azionario statunitense contribuisce a sostenere la propensione al rischio degli investitori, rafforzando così lo slancio rialzista di BTC.
Il principale trend a breve termine rimane rialzista, poiché il prezzo non rompe la zona di supporto di 118.500
XAU/USD – Segnale di rottura verso un nuovo massimo!Sul grafico H1, l'oro mantiene ancora la sua struttura rialzista con picchi e minimi gradualmente crescenti. Dopo la correzione, il prezzo si sta attualmente ritirando verso la zona di supporto di 3820-3830 (coincidente con l'EMA89 e la linea di tendenza ascendente). Questa è un'importante zona cuscinetto che aiuta il prezzo a riprendersi.
Si prevede che, una volta mantenuto questo supporto, l'oro possa recuperare e muoversi verso la zona di resistenza di 3880-3890. Una volta superata quest'area, lo slancio rialzista si rafforzerà, aprendo opportunità per un ulteriore rialzo la prossima settimana.
Macro
La Fed mantiene la sua posizione di graduale allentamento: il mercato sta scontando la possibilità che la Fed tagli i tassi di interesse a fine anno, creando supporto per l'oro. Il dollaro statunitense si è leggermente indebolito e i rendimenti dei titoli di Stato statunitensi sono diminuiti, aiutando l'oro a rimanere al di sopra della linea di tendenza. La geopolitica del Medio Oriente presenta ancora potenziali tensioni, impedendo al flusso di liquidità sicuro verso l'oro di raffreddarsi.
L'oro ha abbastanza forza per rimbalzare da 3890 e entrare in un nuovo trend rialzista, oppure avrà bisogno di un altro consolidamento intorno a 3830 prima di accelerare?

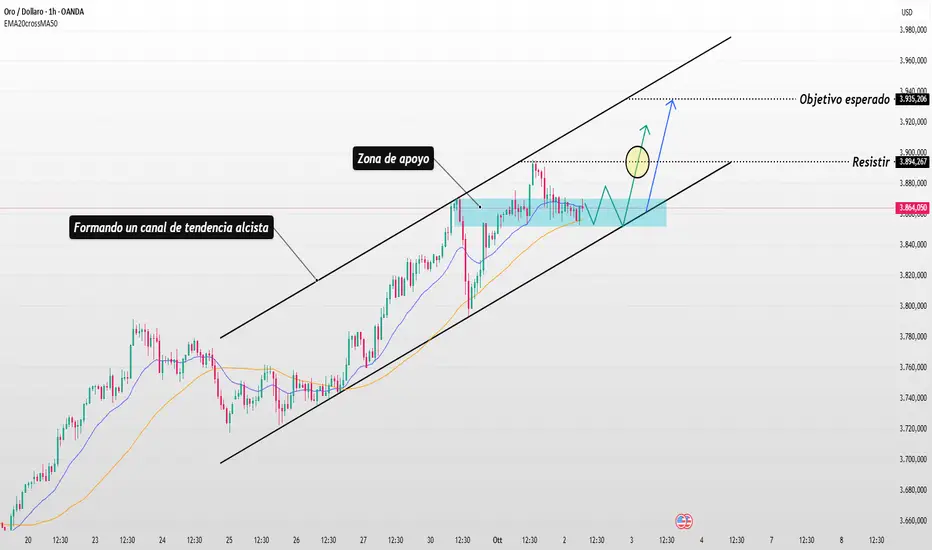
XAU (1H) – Formazione di un nuovo canale di breakout!Il prezzo dell'oro (XAUUSD) si mantiene stabile nel canale rialzista, oscillando attualmente intorno a 3.864. Dopo una breve correzione, l'oro ha ripetutamente testato la zona di supporto dinamico EMA20/MA50 + la trendline inferiore, dimostrando che il potere d'acquisto rimane forte.
La zona di prezzo di 3.894 è quasi una resistenza; se superata con decisione, è probabile che l'oro rimbalzi verso la zona obiettivo di 3.935, il bordo superiore del canale dei prezzi.
Le informazioni macroeconomiche rafforzano il trend rialzista
L'indice USD si è leggermente indebolito dopo che i dati economici statunitensi non sono stati abbastanza forti da esercitare molta pressione sulla Fed. I rendimenti dei titoli di Stato statunitensi si sono temporaneamente raffreddati, supportando l'oro nel mantenere il suo ruolo difensivo.
Il trend principale è ancora rialzista. La strategia appropriata è attendere che il prezzo ritesti la zona di supporto nel canale e poi acquistare, obiettivo a breve termine 3.935.
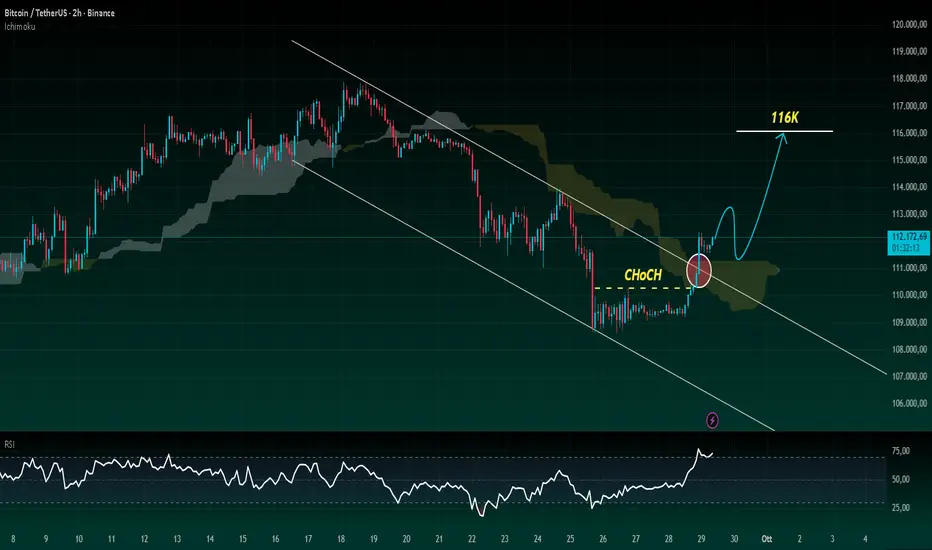
Interrompere il trend ribassista, BTC recupera?Bitcoin sta mostrando un importante segnale di breakout con la rottura del precedente canale ribassista multi-sessione. Sul grafico H2, il pattern CHoCH (Change of Character) viene confermato quando BTC rompe la zona di resistenza a breve termine e rimbalza con forza sopra la nuvola di Ichimoku, accompagnato da una forte pressione di acquisto.
Attualmente, BTC si attesta intorno a 112.000, con un momentum positivo e l'indicatore RSI mantiene una zona alta ma non ha ancora mostrato una divergenza negativa. Questo dimostra che i rialzisti hanno il controllo del mercato e che il trend rialzista a breve termine si è consolidato. Se mantenuto sopra 111.000 - 110.500, il prezzo potrebbe continuare a muoversi verso quota 116.000 nella prossima sessione.
Anche il contesto del mercato delle criptovalute è favorevole: le aspettative per gli ETF spot continuano ad attrarre ingenti flussi di cassa, mentre il sentiment di propensione al rischio torna grazie al temporaneo raffreddamento del dollaro statunitense. Inoltre, l'aumento dell'afflusso di stablecoin nell'exchange supporta anche il trend rialzista a breve termine.
Trend principale: dare priorità al monitoraggio delle posizioni di acquisto, obiettivo vicino a 114.000 - 116.000, con possibilità di espansione a 118.000 se la forza d'acquisto viene mantenuta.
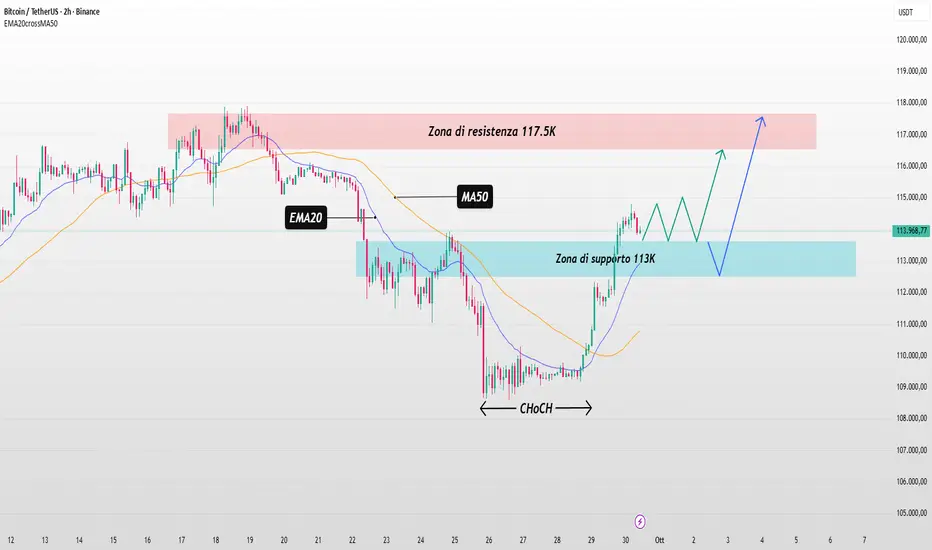
BTC (2H) – Mantieni il supporto, punta alla resistenza!Bitcoin, dopo aver toccato il fondo con il segnale CHoCH (Change of Character), è uscito dal trend ribassista ed è entrato in una fase di recupero. Il prezzo si mantiene attualmente al di sopra dell'importante zona di supporto di 113K, mentre l'EMA20 ha superato la MA50, indicando che la forza rialzista a breve termine si sta consolidando.
Sul fronte del mercato, la ripresa del sentiment generale dopo il forte calo, insieme ai flussi di capitale stabili dagli ETF sulle criptovalute, sta supportando il trend rialzista a breve termine. Questa è la fase in cui il mercato testa la domanda prima di sfidare la zona di resistenza superiore.
Scenario principale: BTC potrebbe continuare a fluttuare e accumularsi al di sopra della zona di supporto di 113K, per poi formare una base di prezzo prima di sfondare verso la zona di resistenza obiettivo di 117K – 117,5K. In caso di una correzione profonda, un nuovo test della zona di 113K è ancora utile per mantenere la struttura rialzista.
👉 BTC accumulerà abbastanza forza da superare presto quota 117,5K oppure avrà bisogno di un nuovo test a 113K prima di continuare il suo percorso ascendente?
XAU (1H) - Regolazione a breve termine nel canale crescente!L'oro ha avuto una forte crescita nella scorsa settimana, toccando l'area di resistenza di 3.860 - 3.880 prima di apparire la forza di utilizzo che fa sì che il prezzo si aggiri. Attualmente, il prezzo è arretrato sotto il canale crescente con un'importante regione di supporto di 3.730 - 3.750. Questa è una convergenza di molti elementi tecnici, che svolge il ruolo della difesa principale a breve termine.
Nonostante l'adattamento, l'EMA20 è ancora sull'EMA50, dimostrando che la forza di acquisto principale non è stata rotta. Anche il modello di canale in aumento viene mantenuto bene, supportando lo scenario dopo il test di supporto, il prezzo tornerà indietro e continuerà verso l'area di resistenza superiore.
A breve termine, quando l'oro ha mantenuto oltre 3.730, è probabile che il mercato assisterà alla forza di acquisto, con l'obiettivo immediato di 3.860 - 3.880, può ulteriormente espandersi in cima al canale in aumento. L'attuale regolazione è considerata un passaggio accumulato per prepararsi al prossimo aumento, anziché per invertire i segnali.
Pensi che l'oro sarà forte dal supporto per continuare l'onda crescente o necessita di un altro che si scuote prima di tornare alla tendenza principale?

L'oro accumula prima di iniziare il nuovo mese!Ciao a tutti!
XAUUSD su OANDA continua a mantenere il suo slancio rialzista dopo aver completato una correzione tecnica e aver rimbalzato dall'importante zona di supporto intorno a 3.840 - 3.850. Questa è l'area di confluenza con il bordo superiore del canale rialzista di breve termine e il precedente FVG, fungendo da trampolino di lancio per il trend.
Il pattern "tazza con manico" sul frame H1 si sta chiaramente formando, a dimostrazione del controllo del mercato da parte degli acquirenti. Se l'area di 3.850 verrà mantenuta, è probabile che l'oro acceleri, dirigendosi verso la successiva resistenza intorno a 3.900 - 3.920, oltre all'obiettivo di 3.940, come mostrato nel grafico.
Oltre ai fattori tecnici, il mercato è supportato da un sentiment difensivo dovuto alle preoccupazioni per l'elevata inflazione e alla prospettiva che la Fed mantenga i tassi di interesse stabili più a lungo. Ciò rafforza il ruolo dell'oro come bene rifugio.
Con la struttura attuale, la preferenza è ancora orientata verso lo scenario rialzista.

XAUUSD – I rialzisti mantengono il ritmo, puntando a 3.840XAUUSD continua a mostrare forza rimbalzando dalla zona EMA e formando un chiaro canale di prezzo rialzista. Attualmente, il prezzo si aggira intorno a $ 3.815, mantenendosi al di sopra dell'importante "zona di supporto" di 3.800-3.805.
I segnali tecnici mostrano che l'EMA 34/89 è ancora orientata al rialzo, con volumi in aumento durante le sessioni di recupero, a dimostrazione del fatto che il flusso di cassa continua a supportare il trend rialzista. Un leggero retest intorno alla zona di supporto prima di continuare a salire è ancora del tutto possibile.
Sul fronte del mercato, l'oro è sostenuto dal sentiment difensivo, con il dollaro USA in leggero indebolimento e i rendimenti dei titoli di Stato statunitensi in calo. Inoltre, le aspettative che la Fed non accelererà la stretta monetaria aiutano il metallo prezioso a mantenere il suo ruolo di bene rifugio in periodi di volatilità.
Il trend principale è ancora rialzista, i trader possono considerare una strategia di acquisto tramite canale, con l'area 3.840 come obiettivo a breve termine da monitorare.

Oro in un pattern Falling Wedge: Pronto per una forte risalitaIl grafico di XAUUSD è davvero interessante in questo momento, con una recente evoluzione che sta dando un aspetto più ottimista al mercato. Sta prendendo forma un pattern di Falling Wedge, che suggerisce un potenziale cambiamento di direzione verso l'alto.
L'interazione più recente è particolarmente interessante, in quanto ha mostrato i primi segnali di recupero, mentre la pressione di vendita sembra essersi indebolita. Ciò che potrebbe accadere ora è che, con volumi di trading più bassi, la pressione ribassista potrebbe esaurirsi, aprendo la strada a una possibile fase di rialzo.
Il mio obiettivo per il futuro si concentra sulla zona 3832, un livello che corrisponde alla parte superiore del canale di prezzo. Se il movimento si sviluppa come previsto, assisteremo a una bellissima narrativa che si svilupperà per l'oro, una storia che stiamo seguendo da vicino.
Questa configurazione è davvero affascinante, come una trama che sta prendendo forma, ma richiede pazienza e conferme.
Anche se esiste uno scenario ribassista possibile, con un supporto chiaro sotto di noi, personalmente mi schiero a favore di un ulteriore rialzo, poiché il pattern che si sta formando sembra suggerirlo con sempre più forza.

Bitcoin bloccato per il weekend!BTC/USDT su BINANCE continua a muoversi all'interno di un pattern di canale discendente sul grafico H1. Dopo aver testato più volte il limite superiore intorno alla zona 109.800-110.000 USDT, il prezzo è stato respinto, dimostrando che la pressione di vendita è ancora dominante.
Il volume di scambi è fortemente distribuito nella zona 109.000-110.000, ma il flusso di cassa non è sufficiente a creare un breakout. Il grafico mostra anche dei gap di fair value (FVG) non colmati, rafforzando la possibilità che il mercato continui a scendere.
Se BTC dovesse rompere la zona 109.000 USDT, lo scenario ribassista sarà confermato con il target più vicino a 107.200 USDT, che coincide con il supporto nel canale. Se la pressione di vendita continua ad aumentare, il prossimo target potrebbe essere verso 105.500-106.000 USDT.
👉 È probabile che BTC continui a essere sotto pressione di vendita questo fine settimana. Gli investitori dovrebbero prestare attenzione agli ordini Long e monitorare la reazione dei prezzi nella zona di supporto di 107.200 USDT.

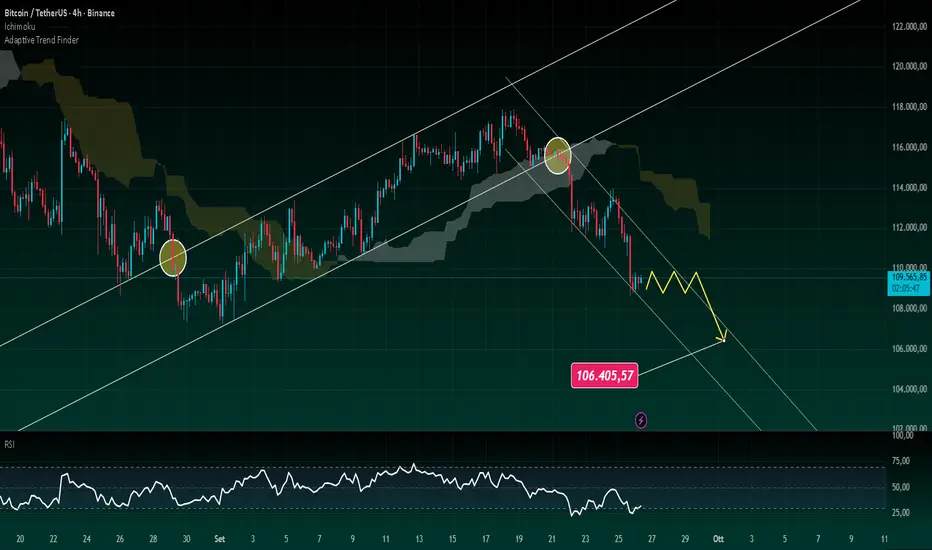
BTC è entrato nell'area pericolosa!BTC dopo aver rotto il canale crescente di medio termine è rapidamente caduto nel canale, confermando la conversione della tendenza. Attualmente, il prezzo sta fluttuando intorno all'area di 109.000 - 110.000, che è una resistenza dinamica importante e si trova vicino al canale di riduzione. L'RSI ha ancora mantenuto al di sotto del livello di 50, dimostrando che la forza di vendita domina ancora.
Lo scenario prioritario a breve termine è il prezzo che può essere laterale nell'area di 109.000 - 110.000 per testare l'offerta e la domanda, quindi affrontare la nuova pressione di vendita, tirare il prezzo per continuare verso l'obiettivo di circa 106.400, coincidendo con il bordo inferiore del canale.
Nel contesto del flusso di cassa che non ha dato il segnale di inversione, la cattura del fondo a breve termine è un rischio elevato. La giusta strategia per i trader è osservare l'attuale area di resistenza, dando la priorità alla vendita dopo la tendenza principale per sfruttare la riduzione.
Gold Excalated - Il mercato sta creando un momentoL'oro (Xauusd) continua a mantenere un drammatico aumento dopo la fuga dal precedente canale di diminuzione e la formazione di una struttura di aumento stabile. Sul frame 2h, il prezzo ha fatto una svolta e mantenuto sulla linea di tendenza di recente formazione, creando fiducia per l'acquirente.
Le continue regioni FVG formate nel recente ritmo crescente stanno fungendo da area di supporto dinamica, aiutando il prezzo della spinta a continuare a salire.
Il mercato internazionale sta anche rafforzando l'aumento dell'oro. Il dollaro è sotto pressione quando gli investitori riducono gradualmente l'aspettativa che la Fed manterrà tassi di interesse elevati per molto tempo, mentre la domanda di rifugio sicuro aumenta leggermente dalle fluttuazioni geopolitiche.
Con i fattori tecnici e di base che supportano, Xauusd dovrebbe continuare ad accumularsi nella regione di 3740–3760 prima di uscire, il nuovo obiettivo è di circa 3780 e ulteriori punti di riferimento psicologico 3800.

XAUUSD: Ipercomprato Indica un Pullback!XAUUSD si sta avvicinando sempre più a una zona di resistenza cruciale al limite superiore del canale ascendente.
Questa zona spesso funge da barriera naturale, dove il mercato tende a rallentare o addirittura invertire la direzione. Man mano che il prezzo si avvicina al limite superiore del canale, aumenta la probabilità di un pullback, poiché la pressione di realizzo dei profitti di solito cresce.
Se si verifica una correzione, il livello 3.715 USD diventerà un supporto chiave da tenere sotto osservazione. La forza dei compratori in questa zona determinerà se il trend rialzista continuerà e spingerà il prezzo a superare i precedenti massimi. Al contrario, se il livello di 3.715 viene rotto, il mercato potrebbe cambiare direzione, con il prezzo che scivola ulteriormente verso la parte inferiore del canale, mettendo sotto pressione i compratori.
In momenti come questo, la cosa più importante non è correre ad entrare nel mercato, ma osservare attentamente. Il mercato lascia sempre tracce attraverso l'azione dei prezzi, i modelli di candlestick e il volume degli scambi. Quando questi tre elementi sono allineati, il segnale di conferma diventa molto più forte, ed è allora che un setup acquisisce realmente valore. E sopra ogni cosa, la gestione del rischio rimane la base fondamentale, poiché è il scudo che protegge il trader dall'incertezza, aprendo allo stesso tempo la possibilità di ottenere profitti con fiducia.
Buona fortuna e continua a fare trading in sicurezza!

XAU/USD – C'è una nuova rottura?L'oro continua a mantenere il suo slancio rialzista dopo aver rotto il precedente canale di accumulazione. Il grafico a 2 ore mostra che il prezzo ha rotto con forza, superando l'EMA 34/89 – un segnale che rafforza il trend rialzista di medio termine. Attualmente, il mercato si sta leggermente adeguando intorno all'area dei 3.780, con un'importante zona di supporto situata intorno a 3.740. Si prevede che questa zona continuerà a reggere, è probabile che il potere d'acquisto ritorni e spinga il prezzo verso un obiettivo più alto.
Oltre ai fattori tecnici, anche il contesto macroeconomico sta supportando l'oro, poiché gli investitori continuano a dare priorità agli asset rifugio, soprattutto in un momento in cui si prevede che la Fed manterrà una politica di allentamento graduale e il dollaro statunitense è temporaneamente stagnante. Ciò crea condizioni favorevoli affinché XAUUSD continui il suo trend rialzista nel prossimo periodo.
I trader stanno monitorando l'importante zona di supporto: sceglieranno di acquistare seguendo il trend o aspetteranno un segnale più chiaro per inserire l'ordine?
