Evening Wrap: ASX 200 is back, baby! Banks, Resources, Property and Consumer stocks push ASX to within whisker of record high
The S&P/ASX 200 closed 103.8 points higher, up 1.23%.
There was a double whammy of goodness for stocks on the ASX today, with bond yields falling at the same time as investors factored out some of their worst fears over the looming trade war.
The best sectors were Financials, Real Estate, Consumer and Gold stocks, but strong gains in the prices of copper and iron ore also helped stocks in the Resources sector that produce them.
Only Energy stocks missed out today, as the prices of key commodities crude oil and uranium were lower overnight.
Click/scroll through for the usual reporting of the major sector and stock-specific moves, the broker responses to them, as well as all the key upcoming economic data in tonight's Evening Wrap.
Also, I have detailed technical analysis on Uranium and Copper in today's ChartWatch.
Let's dive in!
Today in Review
Thu 06 Feb 25, 5:18pm (AEDT)
| Name | Value | % Chg |
|---|---|---|
| Major Indices | ||
| ASX 200 | 8,520.7 | +1.23% |
| All Ords | 8,785.1 | +1.17% |
| Small Ords | 3,228.1 | +0.56% |
| All Tech | 4,012.6 | +0.33% |
| Emerging Companies | 2,350.7 | +0.90% |
| Currency | ||
| AUD/USD | 0.6263 | -0.36% |
| US Futures | ||
| S&P 500 | 6,101.5 | +0.25% |
| Dow Jones | 45,100.0 | +0.21% |
| Nasdaq | 21,821.25 | +0.27% |
| Name | Value | % Chg |
|---|---|---|
| Sector | ||
| Financials | 9,129.9 | +2.00% |
| Consumer Discretionary | 4,165.9 | +1.88% |
| Real Estate | 3,915.6 | +1.34% |
| Industrials | 7,866.4 | +1.02% |
| Materials | 17,013.5 | +0.86% |
| Communication Services | 1,673.4 | +0.52% |
| Health Care | 45,269.9 | +0.52% |
| Utilities | 8,704.0 | +0.31% |
| Consumer Staples | 11,641.1 | +0.30% |
| Information Technology | 2,896.3 | +0.29% |
| Energy | 8,872.8 | -0.31% |
Markets
ASX 200 Session Chart
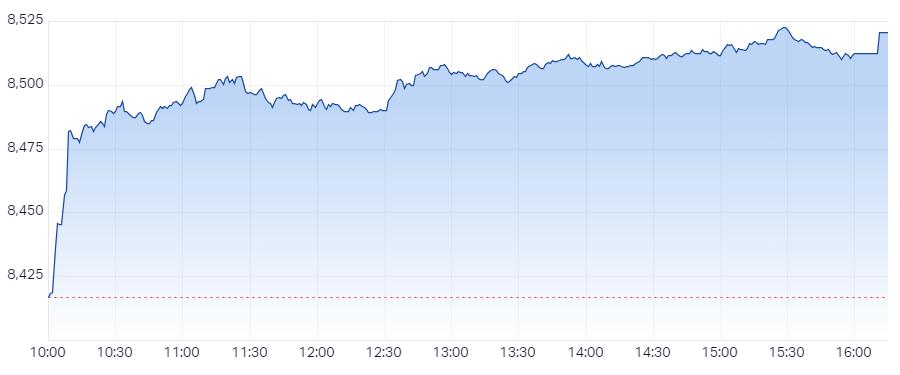
The S&P/ASX 200 (XJO) finished 103.8 points higher at 8,520.7, 1.23% from its session low and within a whisker of closing smack–bang on its session high (missed by 0.03%!). In the broader-based S&P/ASX 300 (XKO), advancers beat decliners by an emphatic 215 to 67.
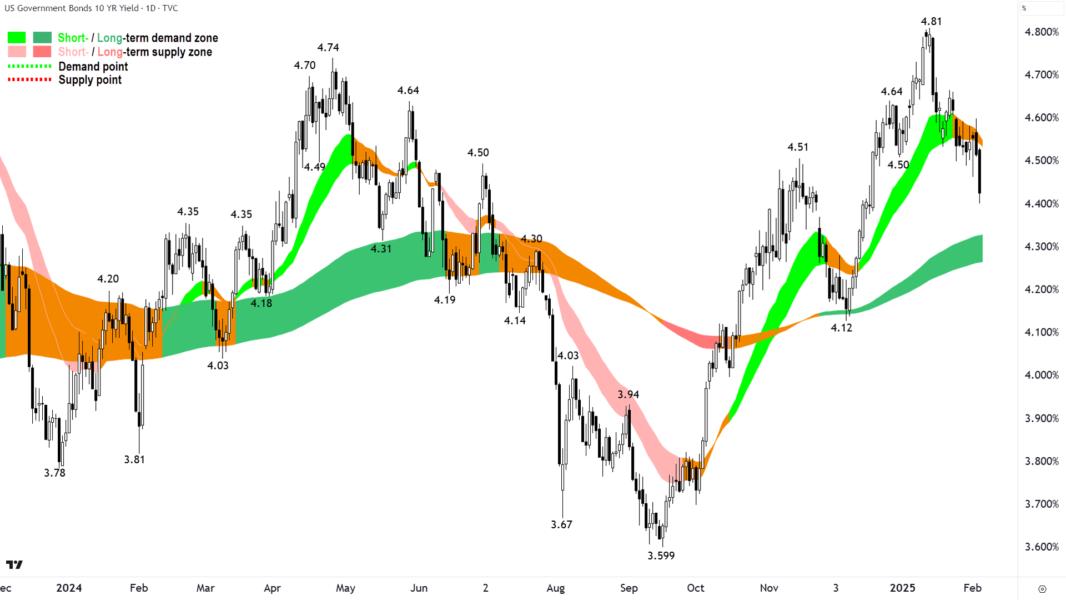
Bonds up, stocks up. Not your typical duo of moves in markets. Stocks are a big ball of risk (yes, even the “blue-chips” in your portfolio!) and bonds are safety. That’s Economics 101. 🧑🎓
So, this means it’s a little unusual (but not impossible) for them both to rise at the same time. You know that stocks were up, because you’ve read the first paragraph above and you know that US stocks were also up overnight. But you might not be across the big move in the bond market in the last 24-hours.
US 10 Year T-Bond Yield chart as at 5 Feb close (
Risk-free market yields tumbled overnight on, well, I wish I could pinpoint it. Yes, there’s a bit going on at the moment geopolitically, and possibly as a result, we’ve seen some flight to safety buying of US Treasuries – but this doesn't get at all with the strength we've seen in stocks.
Given the corresponding dip in the Yuan, my tip is the buying in US Treasuries was due to a spike in demand from Chinese investors and funds – their fear is that Trump's tariffs will be the straw that breaks the camel's back (the camel being the Chinese economy! 🐫).
If my theory is correct, then it explains the goldilocks scenario for stocks over the last 24-hours: Risk-free market yields have dipped sharply and there’s no major reason in the last 24-hours to sell stocks (and perhaps as the trade war shock subsides – there's a few reasons to buy them).
So that’s a double whammy of goodness for stocks. Hence today’s broader move on the ASX 200 – and as you are now experts at interpreting bond yields and stock moves – sector-based moves too.
The best sectors were those that love lower risk-free market yields, like bond proxies Financials (XFJ) (+2.0%) and Real Estate Investment Trusts (XPJ) (+1.4%), mortgage plagued Consumer Discretionary (XDJ) (+1.9%), and opportunity cost plagued Gold (XGD) (+1.7%).
The rest were there or thereabouts, with Resources (XJR) (+0.62%) generally higher on solid gains in copper and iron ore stocks as the prices of both of those commodities rose overnight/today. I have detailed technical analysis on copper for you in ChartWatch.
Company | Last Price | Change $ | Change % | 1mo % | 1yr % |
Electro Optic Systems (EOS) | $1.320 | +$0.105 | +8.6% | +1.9% | +13.8% |
Kelly Partners Group (KPG) | $11.15 | +$0.85 | +8.3% | +2.9% | +103.8% |
WA1 Resources (WA1) | $16.48 | +$1.04 | +6.7% | +14.7% | +62.4% |
Generation Development Group (GDG) | $4.65 | +$0.28 | +6.4% | +24.3% | +154.8% |
News Corporation (NWS) | $56.28 | +$3.07 | +5.8% | +15.7% | +42.8% |
Kingsgate Consolidated (KCN) | $1.360 | +$0.07 | +5.4% | +4.6% | +13.3% |
Opthea (OPT) | $1.155 | +$0.055 | +5.0% | +45.3% | +169.7% |
Aurelia Metals (AMI) | $0.215 | +$0.01 | +4.9% | +26.5% | +104.8% |
Predictive Discovery (PDI) | $0.345 | +$0.015 | +4.5% | +38.0% | +68.3% |
Spartan Resources (SPR) | $1.470 | +$0.06 | +4.3% | -7.8% | +240.1% |
Firefly Metals (FFM) | $0.900 | +$0.035 | +4.0% | +1.1% | +69.8% |
Pantoro (PNR) | $0.130 | +$0.005 | +4.0% | +34.0% | +217.1% |
Westgold Resources (WGX) | $2.51 | +$0.09 | +3.7% | -10.4% | +22.4% |
Vault Minerals (VAU) | $0.420 | +$0.015 | +3.7% | +25.4% | +23.5% |
GQG Partners (GQG) | $2.29 | +$0.08 | +3.6% | +5.5% | +19.9% |
Adairs (ADH) | $2.73 | +$0.09 | +3.4% | +2.2% | +67.5% |
Botanix Pharmaceuticals (BOT) | $0.455 | +$0.015 | +3.4% | -1.1% | +160.0% |
Webjet (WJL) | $0.810 | +$0.025 | +3.2% | -1.2% | 0% |
Wesfarmers (WES) | $77.06 | +$2.36 | +3.2% | +7.4% | +32.4% |
Platinum Asset Management (PTM) | $0.690 | +$0.02 | +3.0% | -2.8% | -20.2% |
Top 20 stocks among the Top 500 ASX stocks today
Only one sector could really be described as doing it tough today, Energy (XEJ) (-0.31%), and to be fair it was for an understandable reason.
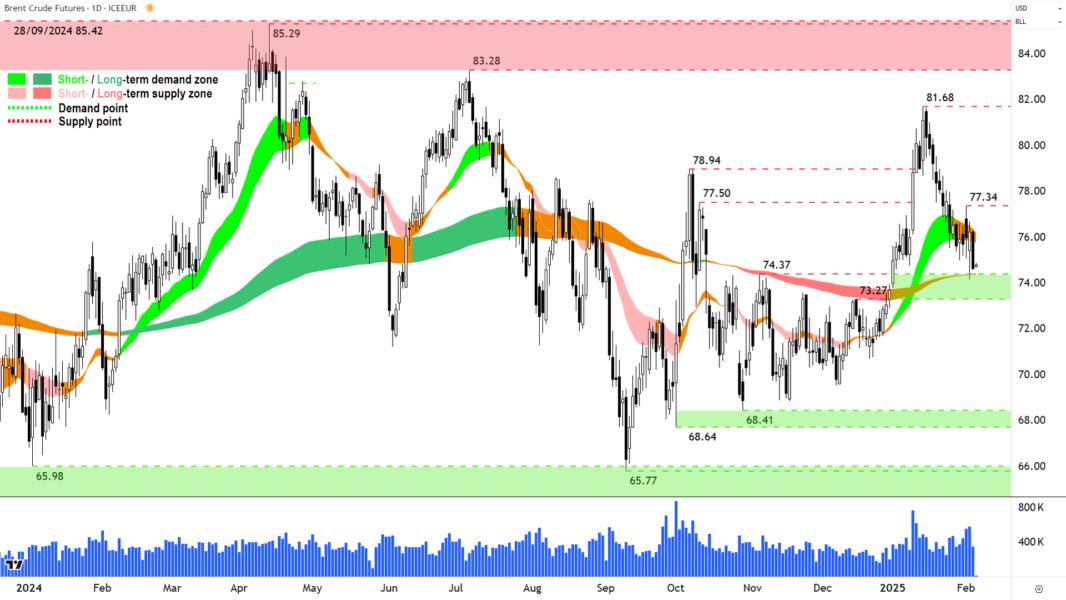
The price of major crude oil contracts fell sharply overnight and to their lowest level since the start of the year, as markets grappled with a myriad of factors (tariffs, retaliatory tariffs, Iran sanctions, Trump interjecting in Gaza, Saudi price hike to Asia, higher than expected US crude inventories…you get the picture! 🤯)
Brent Crude Oil Futures (Front month, back-adjusted) ICE (click here for full size image)
The uranium price was also lower, a fact made more disappointing for uranium bulls given its chart shows another fledgling rally appears to be on the verge of being extinguished. I have detailed technical analysis for you in ChartWatch.
Uranium stocks are part of the XEJ, and they were also generally lower today, contributing to the index’s underperformance.
Company | Last Price | Change $ | Change % | 1mo % | 1yr % |
Paradigm Biopharmaceuticals. (PAR) | $0.480 | -$0.065 | -11.9% | +7.9% | +52.4% |
The Star Entertainment Group (SGR) | $0.115 | -$0.01 | -8.0% | -37.8% | -77.9% |
Myer (MYR) | $0.840 | -$0.05 | -5.6% | -26.6% | +29.7% |
Brainchip (BRN) | $0.280 | -$0.015 | -5.1% | -21.1% | +75.0% |
Cettire (CTT) | $1.235 | -$0.065 | -5.0% | -14.5% | -61.8% |
Beach Energy (BPT) | $1.440 | -$0.075 | -5.0% | -0.7% | -12.5% |
Clarity Pharmaceuticals (CU6) | $3.73 | -$0.19 | -4.8% | -10.1% | +59.2% |
Zip Co. (ZIP) | $2.17 | -$0.09 | -4.0% | -33.8% | +212.2% |
Life360 (360) | $23.38 | -$0.92 | -3.8% | -0.6% | +204.8% |
Mesoblast (MSB) | $2.92 | -$0.1 | -3.3% | -7.9% | +1023.1% |
Appen (APX) | $2.79 | -$0.09 | -3.1% | -10.0% | +896.4% |
Pexa Group (PXA) | $12.45 | -$0.39 | -3.0% | -4.8% | +8.2% |
Bellevue Gold (BGL) | $1.220 | -$0.035 | -2.8% | +23.2% | -9.0% |
Strike Energy (STX) | $0.215 | -$0.005 | -2.3% | +4.9% | -49.4% |
Nexgen Energy (NXG) | $10.50 | -$0.24 | -2.2% | -13.0% | -16.7% |
Lotus Resources (LOT) | $0.240 | -$0.005 | -2.0% | +4.3% | -23.8% |
Catapult Group International (CAT) | $3.90 | -$0.08 | -2.0% | +7.4% | +217.1% |
Bannerman Energy (BMN) | $3.06 | -$0.06 | -1.9% | -9.5% | -12.6% |
Karoon Energy (KAR) | $1.575 | -$0.03 | -1.9% | +9.8% | -19.0% |
Viva Energy Group (VEA) | $2.47 | -$0.04 | -1.6% | -9.2% | -31.8% |
Worst 20 stocks among the Top 500 ASX stocks today
ChartWatch
Uranium Futures (Front month, back-adjusted) COMEX
Anyone for a uranium roll? 🍥 (click here for full size image)
The last time we covered uranium was in ChartWatch in the Evening Wrap on 30 January.
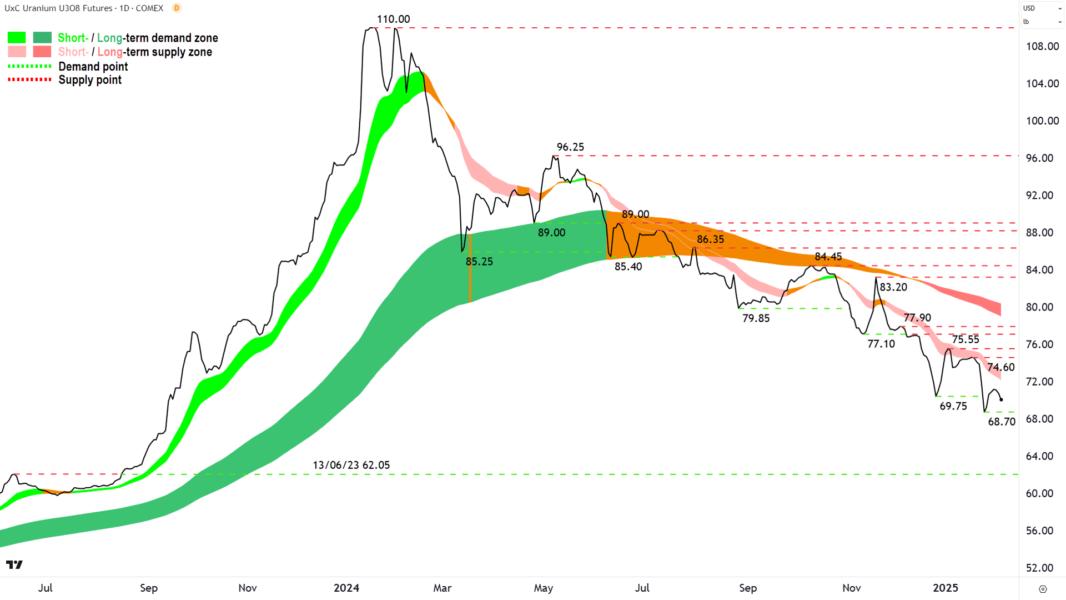
In that update, ironically, we started by discussing how so many times in ChartWatch I've put up a chart of uranium during an uptick, only to warn – and then see it – roll over in line with the prevailing short and long term downtrends.
It appears that it’s happening again. Another uranium roll!
The bounce that preceded this roll, was by standards set by previous bounces – particularly pathetic. There just doesn't seem to be any great impetus among the demand-side to FOMO into this market.
The supply-side looks rock-solid, only too happy to tip supply into any uptick in demand they see. It’s like they know prices aren’t going any higher – so they might as well take advantage of any rally the get.
Short and long term ribbons look the goods here – repelling each fledgling rally as they come – so why would you doubt their substantial credentials?
In conclusion, supply-side control remains the status quo for now. (Hey, if you’re a uranium bull, don’t get angry with me for calling it the way I see it – blame the supply side and or the demand side for not doing what you want them to! 😁)
68.70 is the next point of demand, and below it, very little until the 13-Jun 2023 previous point of supply at 62.05 (old points of supply tend to act as future points of demand).
Ergo, until we’re trading above at least the short term downtrend ribbon, it’s hard to take any subsequent rally here seriously. Ideally also if that feat should occur, we’re also observing rising troughs (at least), but preferably also rising peaks.
Looking at static supply points, 74.60-75.55 is the first critical level, then 77.10-77.90. Again, no dice on rally credibility until the demand-side can consume the latent supply at each.
High Grade Copper Futures (Front month, back-adjusted) COMEX
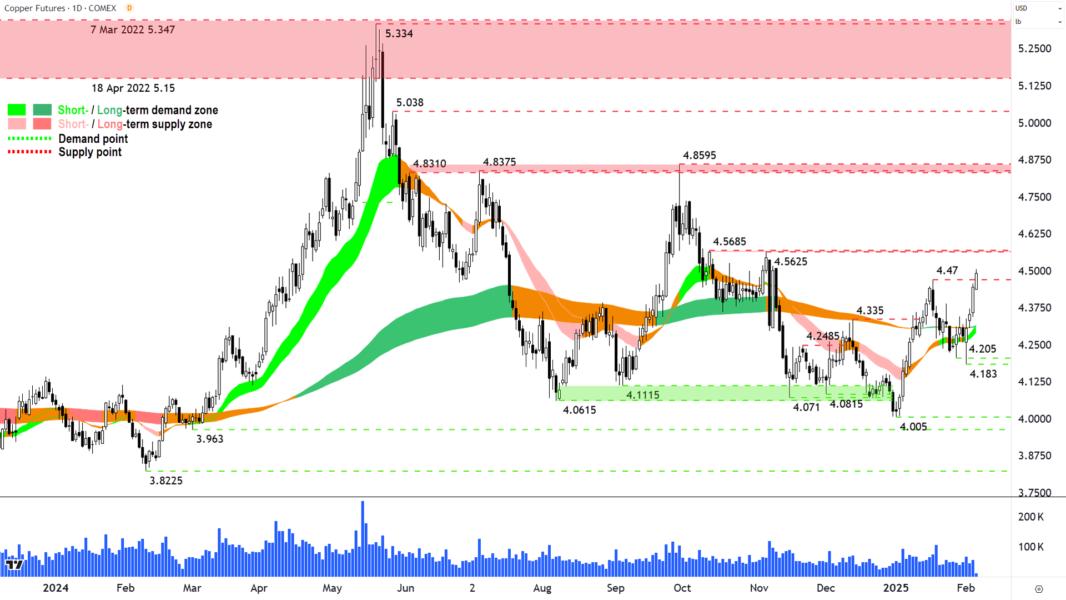
Sure copper, not going to fall for that one again...! 🙈 (click here for full size image)
The last time we covered high grade copper was in ChartWatch in the Evening Wrap on Evening Wrap on 31 January.
In that update, I got a bit down on copper due to its utter lack of ability to follow through on any rally that even resembled half-decent. Time and time again through 2024 it tried and failed to deliver on its “next big thing” status.
I think I said something along the lines of “…total and abject lack of a decisive long term trend. So for me, the copper chart is a big pile of ho-hum.”
Well, here we are with copper looking half-decent again, and I am of the mind to swing back to bullish. The push from 4.205 (new point of demand was set at 4.183) looks demand-side control credible:
Strong white candle bodies and or downward pointing shadows ✅
A sharp rally like the last push from 4.005-4.47 ✅
Nudging the 4.47 point of supply (note that last candle is live – so as far as I’m concerned the supply at 4.47 has not been officially extinguished) ✅
But, as I mentioned last time, the elephant in the room here remains the long term trend, or rather, the total lack of one.
This last rally looks promising, but even if the demand-side can take out 4.47, then supply at 4.5625-4.5685 awaits. I suggest things are going to look far more convincing above that zone of supply, but ditto what about 4.831-4.8595? And then there's the monster of 5.15-5.347?
Perhaps I’m over analysing this one. The short term trend ribbon is up, and it’s doing its job of acting as dynamic demand. If I squint, I can say roughly the same for the long term trend ribbon. And I do like those last few candles.
Let’s take the bait then! Short term bullish and long term optimistic (and I bet you a million bucks – I'm destined to be disappointed by copper again! 😁)
Economy
Today
There weren't any major data releases in our time zone today
Later this week
Friday
00:00 USA Prelim Nonfarm Productivity & Unit Labor Costs December Quarter
Productivity: +1.8% p.a. forecast vs +2.2% p.a. in September quarter
Labor Costs: +3.3% p.a. forecast vs +0.8% p.a. in September quarter
Saturday
00:30 USA Non-Farm Payroll Data January
Employment Change: +154,000 forecast vs +256,000 in December
Average Hourly Earnings: +0.3% m/m forecast vs +0.3% m/m in December
Unemployment Rate: 4.1% forecast vs 4.1% in December
Latest News
Reporting Season pni rea
What's fueling this reporting season's wild swings?
Thu 06 Feb 25, 4:06pm (AEDT)
Midday Market Movers bpt bwp
Biggest ASX movers at noon: News Corp, Generation Development, REA Group and more
Thu 06 Feb 25, 12:39pm (AEDT)
Earnings Highlights rea
REA Group 1H25 Earnings Call Highlights
Thu 06 Feb 25, 12:03pm (AEDT)
Uranium 1ae aee
What’s going on with the uranium market?
Thu 06 Feb 25, 11:45am (AEDT)
Earnings Highlights nws
News Corp Q2 Earnings Call Highlights
Thu 06 Feb 25, 11:02am (AEDT)
Reporting Season rea
Did REA Group’s first-half result meet expectations?
Thu 06 Feb 25, 10:26am (AEDT)
More News
Interesting Movers
Trading higher
+25.0% Almonty Industries (AII) - No news, rise is consistent with prevailing short and long term uptrends 🔎📈
+21.3% Ausquest (AQD) - Cangallo Discovery Confirmed, rise is consistent with prevailing short and long term uptrends,
+9.8% Titomic (TTT) - No news, rise is consistent with prevailing short and long term uptrends, a regular in ChartWatch ASX Scans Uptrends list 🔎📈
+8.6% Electro Optic Systems (EOS) - No news. 🤔
+8.3% Antipa Minerals (AZY) - No news, general strength across the broader Gold sector today, rise is consistent with prevailing short and long term uptrends, a regular in ChartWatch ASX Scans Uptrends list 🔎📈
+8.3% Kelly Partners Group (KPG) - No news since 05-Feb Half Yearly Report and Accounts, rebound following yesterday's sharp sell-off due to N.
+6.7% WA1 Resources (WA1) - Continued positive response to 04-Feb West Arunta Project - Luni Metallurgical Results.
+6.4% Generation Development Group (GDG) - No news, initiated at overweight at Morgan Stanley with a price target of $4.90, rise is consistent with prevailing short and long term uptrends, a regular in ChartWatch ASX Scans Uptrends list 🔎📈
+5.8% News Corporation (NWS) - FY2025 Second Quarter Earnings Release, retained at buy at UBS with a price target of $64.50, rise is consistent with prevailing short and long term uptrends, a regular in ChartWatch ASX Scans Uptrends list 🔎📈
+5.4% Kingsgate Consolidated (KCN) - No news since 04-Feb Production Milestone at Chatree Gold Mine, general strength across the broader Gold sector today.
+5.0% Opthea (OPT) - Opthea Wet AMD Data Featured at Macula Society Meeting, rise is consistent with prevailing short and long term uptrends, a regular in ChartWatch ASX Scans Uptrends list 🔎📈
+4.9% Aurelia Metals (AMI) - No news since 04-Feb Blue Ocean Equities Mining Conference - Presentation, general strength across the broader Resources sector today, rise is consistent with prevailing short and long term uptrends, added to ChartWatch ASX Scans Uptrends list yesterday 🔎📈
+4.5% Predictive Discovery (PDI) - No news since 04-Feb $69M Strategic Placement to Lundin Family and Zijin Mining, general strength across the broader Gold sector today, rise is consistent with prevailing short and long term uptrends, a recent regular in ChartWatch ASX Scans Uptrends list 🔎📈
+4.3% Larvotto Resources (LRV) - No news since 03-Feb Company Presentation - 121 Mining, general strength across the broader Gold sector today, rise is consistent with prevailing short and long term uptrends, a recent regular in ChartWatch ASX Scans Uptrends list 🔎📈
+4.3% Spartan Resources (SPR) - No news, general strength across the broader Gold sector today, rise is consistent with prevailing long term uptrend 🔎📈
+4.2% Cuscal Group (CCL) - No news, rise is consistent with prevailing short and long term uptrends, a regular in ChartWatch ASX Scans Uptrends list 🔎📈
Trading lower
-24.1% Petratherm (PTR) - Drilling Confirms Potential for World-Class Titanium Project.
-11.9% Paradigm Biopharmaceuticals. (PAR) - No news. 🤔
-8.0% The Star Entertainment Group (SGR) - No news, fall is consistent with prevailing short and long term downtrends, one of the most Featured (highest conviction) stocks in ChartWatch ASX Scans Downtrends list 🔎📉
-5.6% Myer (MYR) - No news, fall is consistent with prevailing short term downtrend and long term trend is transitioning from up to down 🔎📉
-5.1% Brainchip (BRN) - No news, move is consistent with recent volatility.
-5.0% Cettire (CTT) - No news, fall is consistent with prevailing short and long term downtrends, a regular in ChartWatch ASX Scans Downtrends list 🔎📉
-5.0% Beach Energy (BPT) - Beach Energy FY25 half year results and Beach Energy FY25 half year results presentation, general weakness across the broader Energy sector today,
-4.8% Clarity Pharmaceuticals (CU6) - No news, fall is consistent with prevailing short and long term downtrends, a regular in ChartWatch ASX Scans Downtrends list 🔎📉
-4.0% Zip Co. (ZIP) - Continued negative response to 30-Jan 2Q FY25 Results Update, fall is consistent with prevailing short term downtrend and long term trend is transitioning from up to down, added to ChartWatch ASX Scans Downtrends list yesterday 🔎📉
-3.0% Pexa Group (PXA) - 1HY25 non-operating items guidance update and Resignation of CEO Australia and PEXA KMP, fall is consistent with prevailing short term downtrend and long term trend is transitioning from up to down 🔎📉
Broker Moves
AGL Energy (AGL)
Retained at overweight at Morgan Stanley; Price Target: $12.88
Air New Zealand (AIZ)
Retained at outperform at Macquarie; Price Target: NZ$0.80 from NZ$0.79
Aristocrat Leisure (ALL)
Retained at outperform at Macquarie; Price Target: $80.00
Amcor (AMC)
Retained at outperform at CLSA; Price Target: $17.00
Retained at outperform at Macquarie; Price Target: $18.20 from $18.00
Retained at equal-weight at Morgan Stanley; Price Target: $15.50
Retained at hold at Morgans; Price Target: $16.45 from $15.75
Retained at hold at Ord Minnett; Price Target: $15.25 from $15.50
Retained at neutral at UBS; Price Target: $16.90 from $16.65
Amotiv (AOV)
Retained at buy at Citi; Price Target: $12.65
Retained at outperform at Macquarie; Price Target: $13.64
Eagers Automotive (APE)
Retained at sell at Citi; Price Target: $9.50
Retained at neutral at Macquarie; Price Target: $10.50
ARB Corporation (ARB)
Retained at neutral at Macquarie; Price Target: $43.80
Retained at buy at Ord Minnett; Price Target: $47.15
Autosports Group (ASG)
Retained at neutral at Citi; Price Target: $1.750
Retained at outperform at Macquarie; Price Target: $2.35
Bapcor (BAP)
Retained at neutral at Citi; Price Target: $5.17
Bluebet (BBT)
Retained at buy at Ord Minnett; Price Target: $0.460 from $0.380
Beach Energy (BPT)
Retained at sell at Citi; Price Target: $1.300
Retained at neutral at RBC Capital Markets; Price Target: $1.350
Brightstar Resources (BTR)
Retained at buy at Shaw and Partners; Price Target: $0.040
BWP Trust (BWP)
Upgraded to neutral from sell at Citi; Price Target: $3.40
Retained at equal-weight at Morgan Stanley; Price Target: $3.90
Upgraded to buy at UBS; Price Target: $4.05 from $4.01
Car Group (CAR)
Retained at buy at Citi; Price Target: $42.40
Centuria Office Reit (COF)
Retained at hold at Bell Potter; Price Target: $1.200 from $1.250
Retained at underweight at Jarden; Price Target: $1.170 from $1.150
Retained at underweight at Morgan Stanley; Price Target: $1.230
Retained at sell at UBS; Price Target: $1.140
Comet Ridge (COI)
Retained at buy at Bell Potter; Price Target: $0.210 from $0.260
Computershare (CPU)
Retained at equal-weight at Morgan Stanley; Price Target: $31.10 from $27.70
Cleanaway Waste Management (CWY)
Retained at overweight at Morgan Stanley; Price Target: $3.23
Fleetpartners Group (FPR)
Retained at buy at Citi; Price Target: $3.90
Retained at outperform at Macquarie; Price Target: $3.65
Generation Development Group (GDG)
Initiated at overweight at Morgan Stanley; Price Target: $4.90
Iluka Resources (ILU)
Retained at outperform at Macquarie; Price Target: $6.80
Light & Wonder (LNW)
Retained at outperform at Macquarie; Price Target: $180.00
McMillan Shakespeare (MMS)
Retained at buy at Citi; Price Target: $18.40
Retained at outperform at Macquarie; Price Target: $20.78
News Corporation (NWS)
Retained at positive at E&P; Price Target: $55.10
Retained at buy at UBS; Price Target: $64.50
Origin Energy (ORG)
Retained at underweight at Morgan Stanley; Price Target: $8.97
Pilbara Minerals (PLS)
Upgraded to neutral from sell at Goldman Sachs; Price Target: $2.10 from $2.40
Retained at buy at Jarden; Price Target: $2.60 from $2.50
Patriot Battery Metals (PMT)
Retained at outperform at Macquarie; Price Target: $0.560 from $0.700
Pinnacle Investment Management Group (PNI)
Retained at add at Morgans; Price Target: $27.50 from $27.25
Retained at buy at Ord Minnett; Price Target: $28.00 from $26.00
Platinum Asset Management (PTM)
Upgraded to hold from sell at Bell Potter; Price Target: $0.700 from $0.590
Peter Warren Automotive (PWR)
Retained at neutral at Citi; Price Target: $1.600
REA Group (REA)
Retained at buy at Citi; Price Target: $230.00
Retained at neutral at E&P; Price Target: $206.80
Retained at buy at UBS; Price Target: $268.00
Ramsay Health Care (RHC)
Retained at neutral at Macquarie; Price Target: $35.90 from $42.75
SG Fleet Group (SGF)
Retained at outperform at Macquarie; Price Target: $3.18
Smartgroup Corporation (SIQ)
Retained at outperform at Macquarie; Price Target: $9.60
Santos (STO)
Retained at overweight at Morgan Stanley; Price Target: $7.77
Treasury Wine Estates (TWE)
Retained at buy at Goldman Sachs; Price Target: $13.00
Retained at buy at Jarden; Price Target: $14.70 from $14.10
WA1 Resources (WA1)
Retained at buy at Canaccord Genuity; Price Target: $28.00
Wesfarmers (WES)
Retained to neutral from sell at UBS; Price Target: $76.00 from $69.00
Scans
Top Gainers
| Code | Company | Last | % Chg |
|---|---|---|---|
| MQR | Marquee Resources... | $0.013 | +30.00% |
| OZM | Ozaurum Resources... | $0.135 | +28.57% |
| SVG | Savannah Goldfiel... | $0.019 | +26.67% |
| AII | Almonty Industrie... | $1.925 | +25.00% |
| OMX | Orange Minerals NL | $0.031 | +24.00% |
View all top gainers
Top Fallers
| Code | Company | Last | % Chg |
|---|---|---|---|
| UCM | Uscom Ltd | $0.017 | -32.00% |
| SOC | Soco Corporation Ltd | $0.091 | -27.20% |
| PTR | Petratherm Ltd | $0.30 | -24.05% |
| AKO | Akora Resources Ltd | $0.11 | -21.43% |
| EQR | EQ Resources Ltd | $0.033 | -21.43% |
View all top fallers
52 Week Highs
| Code | Company | Last | % Chg |
|---|---|---|---|
| OZM | Ozaurum Resources... | $0.135 | +28.57% |
| AII | Almonty Industrie... | $1.925 | +25.00% |
| PKD | Parkd Ltd | $0.043 | +22.86% |
| AQD | Ausquest Ltd | $0.057 | +21.28% |
| PGH | Pact Group Holdin... | $0.96 | +18.52% |
View all 52 week highs
52 Week Lows
| Code | Company | Last | % Chg |
|---|---|---|---|
| M2M | MT Malcolm Mines NL | $0.013 | -18.75% |
| HMG | Hamelin Gold Ltd | $0.055 | -15.39% |
| GLE | GLG Corp Ltd | $0.17 | -10.53% |
| TOY | Toys'R'US ANZ Ltd | $0.041 | -8.89% |
| MGT | Magnetite Mines Ltd | $0.096 | -8.57% |
View all 52 week lows
Near Highs
| Code | Company | Last | % Chg |
|---|---|---|---|
| WVOL | Ishares MSCI Worl... | $43.66 | +0.62% |
| AII | Almonty Industrie... | $1.925 | +25.00% |
| IAGPF | Insurance Austral... | $105.00 | +0.23% |
| VVLU | Vanguard Global V... | $76.09 | +0.88% |
| IHD | Ishares S&P/ASX D... | $14.79 | +0.89% |
View all near highs
Relative Strength Index (RSI) Oversold
| Code | Company | Last | % Chg |
|---|---|---|---|
| CCR | Credit Clear Ltd | $0.28 | -5.09% |
| VUL | Vulcan Energy Res... | $4.14 | -1.43% |
| DUG | DUG Technology Ltd | $1.085 | -4.41% |
| PLY | Playside Studios Ltd | $0.21 | -2.33% |
| ARB | ARB Corporation Ltd | $37.00 | +0.35% |
View all RSI oversold