ASX 200 at record highs. Here's what tends to happen next
- The ASX 200 closed above 8,900 for the first time, marking its 16th record high this year despite consensus earnings growth for FY25 sitting at negative 1.7%.
- Historical data from 126 weekly all-time highs since 2000 shows the market typically continues higher.
- Bell Potter's Richard Coppleson assigns 75% odds to a 5% correction within two months but views any pullback as a buying opportunity ahead of expected Fed rate cuts.
The S&P/ASX 200 rallied 0.73% last Friday to close above 8,900 for the first time on record, marking the 16th record high of the year. This milestone caps a powerful 22% move from Liberation Day lows (7 April), bringing year-to-date gains to 9.6% and twelve month returns to 12%.
Market are feeling awfully frothy right now, which begs the question – should I be taking profits at these record levels?
The timing feels particularly precarious in the midst of August reporting season. Consensus earnings growth for the broader market sits at negative 1.7%, weighed down by commodity price weakness, China growth concerns, and tariff impacts. Despite trading at all-time highs, there appears to be more to worry about than celebrate.
Yet markets typically price future expectations rather than current conditions, anticipating more rate cuts and consensus expectations of 5.3% earnings growth in FY26 and 7.4% in FY27.
A history of all-time highs
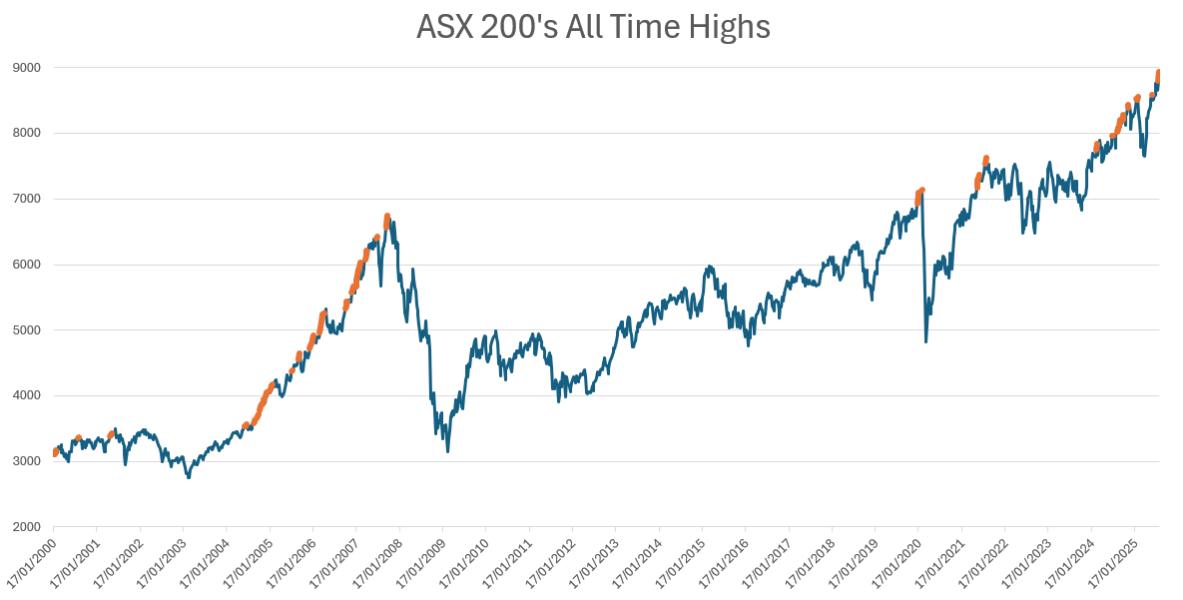
Since 2000, the ASX 200 has recorded 125 weekly all-time highs. In other words, the market hits a fresh all-time high approximately 9.3% of the time, or once every 11 weeks.
Plotting the data on a chart tells us a rather simple story: All-time highs generally come in clusters, and keep going ... until they don't.

Source: Author's own research
How does the market perform after a record high?
To understand what typically happens next, let's examine how the market performed across various timeframes after hitting a weekly record high.
The data below covers 126 weekly all-time highs and excludes any dates that don't have enough forward looking data.
1 Month | 6 Months | 1 Year | 2 Years | |
|---|---|---|---|---|
Average | -0.4% | 2.7% | 6.4% | 5.7% |
Median | 0.4% | 3.3% | 10.6% | 4.9% |
% Higher | 56% | 66% | 65% | 56% |
Source: Author's own research
While the data shows relatively positive performance across all timeframes, it's heavily influenced by the 2003-2007 bull market, which saw the ASX 200 rally 145% before collapsing 50% by March 2009.
Where to from here?
Bell Potter's Richard Coppleson warns that markets appear "stretched" entering the traditionally volatile August-September period. With selloffs of 3% or more typically occurring every 1.5-2 months. Since its been over three months since the last one, he assigns 75% odds to a ~5% correction within two months.
However, Coppleson views any pullback as a buying opportunity, citing the "cash on the sidelines" phenomenon he's observed over 30 years, where dips get bought aggressively. Expected Federal Reserve rate cuts from September, combined with fund managers' substantial underweight equity positioning, should create powerful "Fear of Underperforming Benchmark" dynamics.
He anticipates the selloff occurring mid-September through early October, with October serving as the "Bear Killer" month that historically establishes lows in the first two weeks before delivering extraordinary bounces. Fund managers who miss this anticipated dip risk massive underperformance during what's typically the strongest quarter for equities.
The bottom line
Markets remain buoyant, with earnings so from bellwethers like Commonwealth Bank, JB Hi-Fi, and REITs largely meeting expectations, though some stocks have struggled with valuation concerns. Given the recent run-up and September's seasonal weakness, a long-awaited correction appears increasingly likely. However, absent any abnormal catalyst, the path of least resistance remains higher.