ChartWatch ASX Scans: Ansell, Ausgold, Botanix, Genesis Minerals, Lendlease, Titomic, A2 Milk, Ampol, Dicker Data
- Interesting uptrends in today's Scans: Ausgold (AUC), Botanix (BOT), Breville (BRG), Brambles (BXB), Codan (CDA), Catalyst Metals (CYL), Genesis Minerals (GMD), Healius (HLS), Opthea (OPT), Pro Medicus (PME), Spartan Resources (SPR), Titomic (TTT)
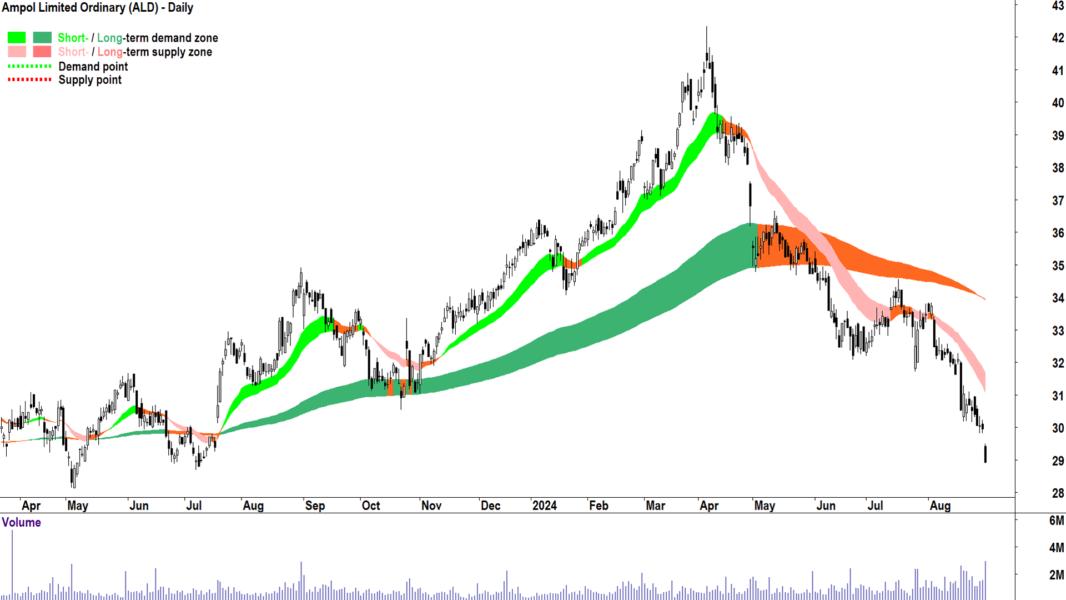
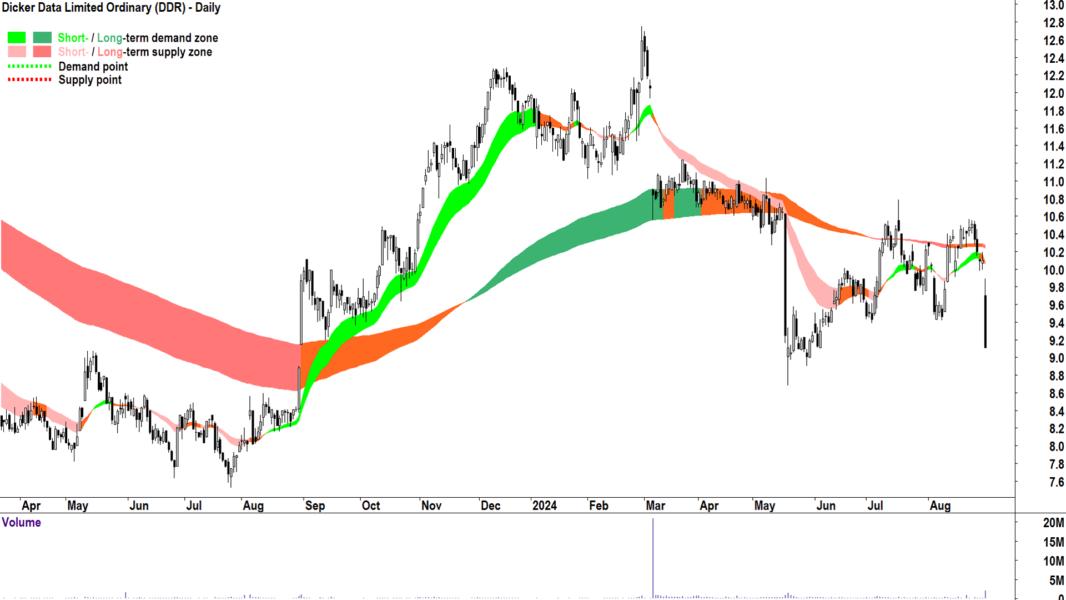
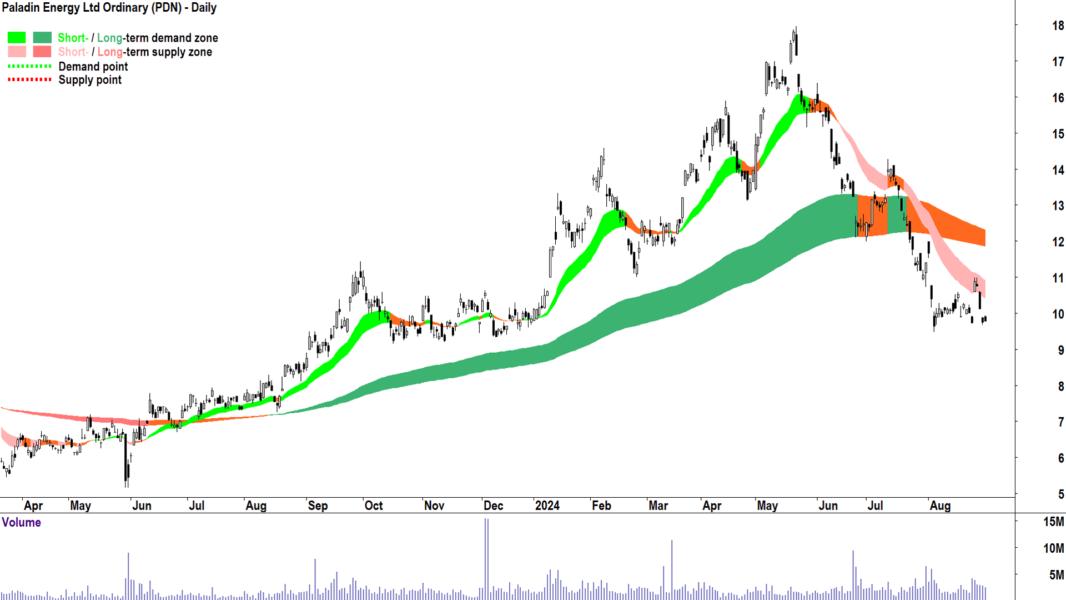
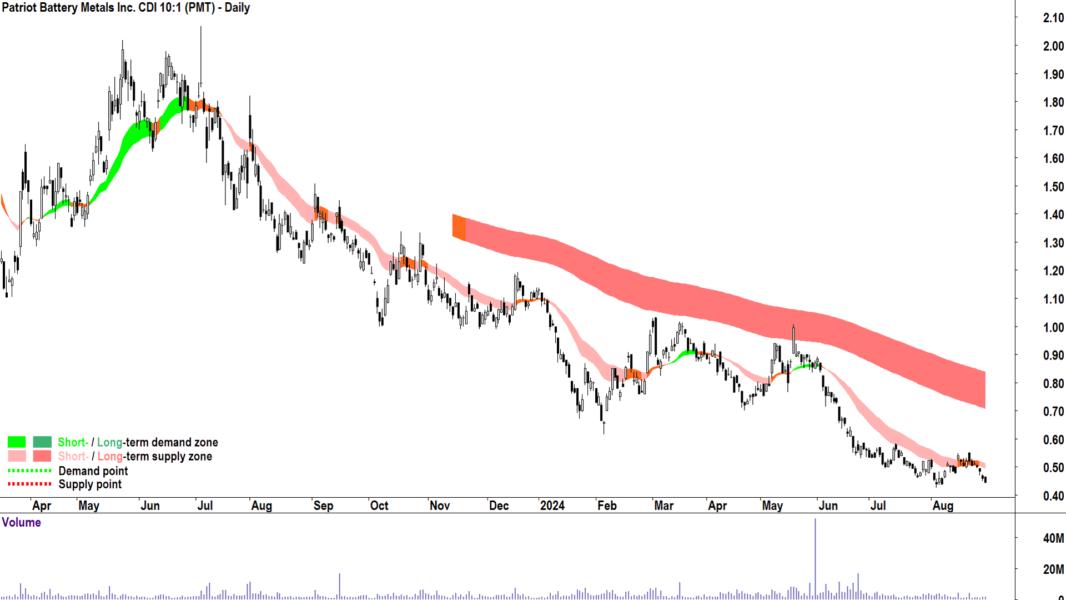
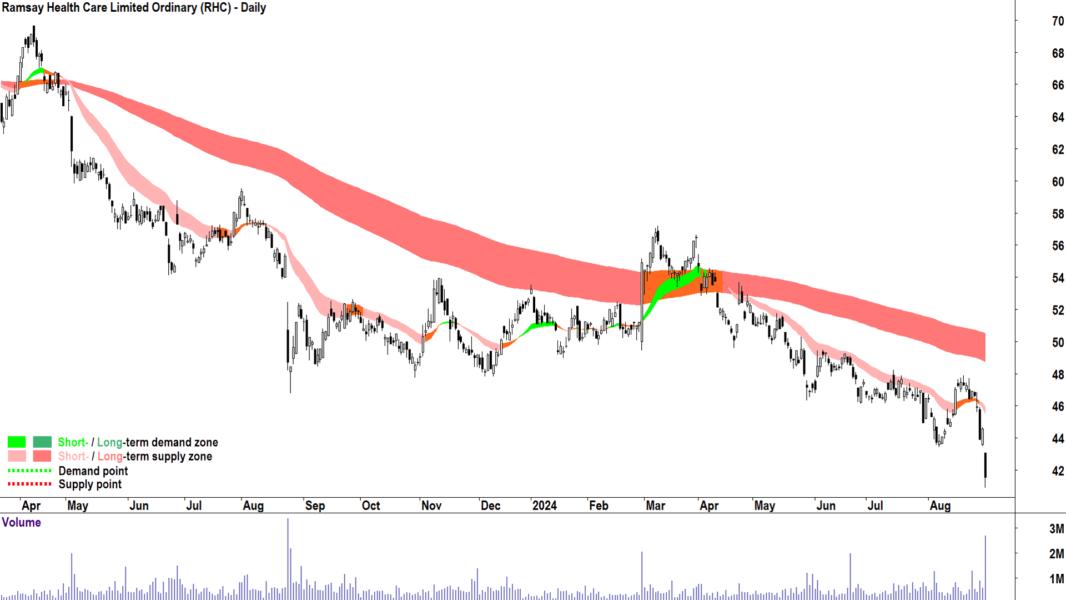
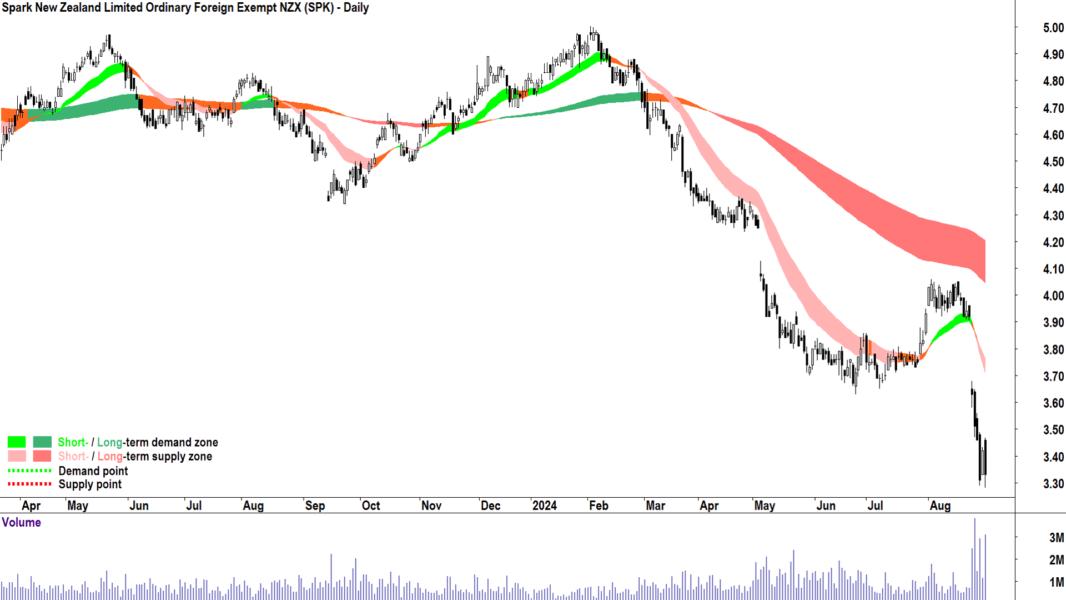
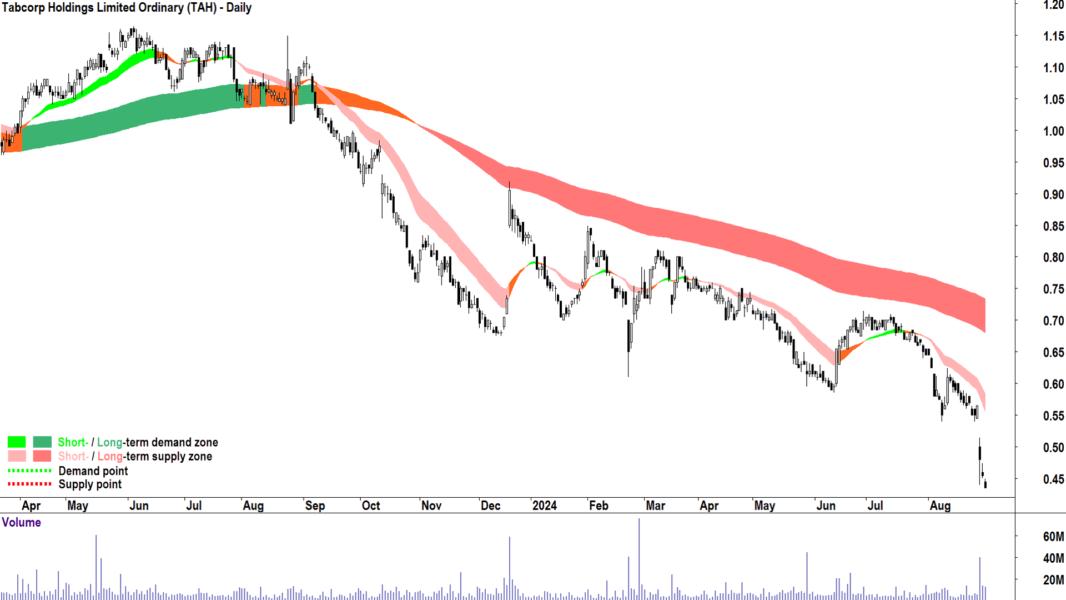
- Interesting downtrends in today's Scans: The A2 Milk Company (A2M), Ampol (ALD), Dicker Data (DDR), Paladin Energy (PDN), Patriot Battery Metals (PMT), Ramsay Health Care (RHC), Spark New Zealand (SPK), Tabcorp (TAH)
Welcome to my ChartWatch Daily ASX Scans series. Here I present scan lists based on my trend following technical analysis methodology. My goal is to alert you to the best uptrends and downtrends on the ASX.
Uptrends Scan List
Company | Code | Last Price | 1mo % | 1yr % |
|---|---|---|---|---|
AI-Media Technologies | AIM | $0.550 | +27.9% | +107.5% |
Argo Global Listed Infrastructure | ALI | $2.29 | +6.0% | +4.6% |
AGL Energy | AGL | $11.61 | +9.9% | +4.6% |
Aristocrat Leisure | ALL | $54.71 | +0.7% | +34.3% |
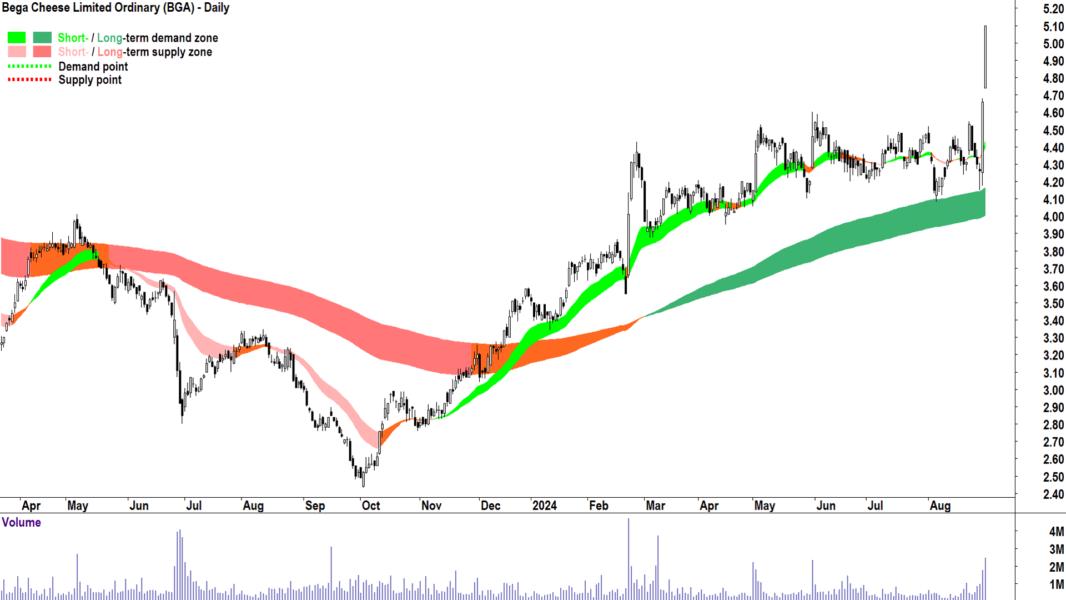
Bega Cheese | BGA | $5.10 | +15.4% | +69.4% |
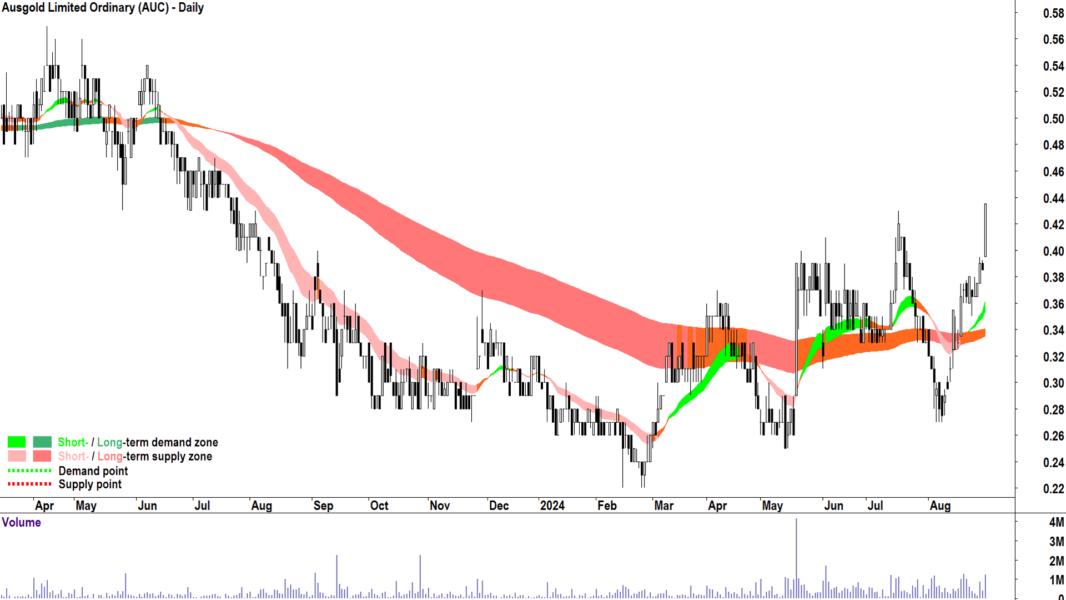
Ausgold | AUC | $0.435 | +35.9% | +31.8% |
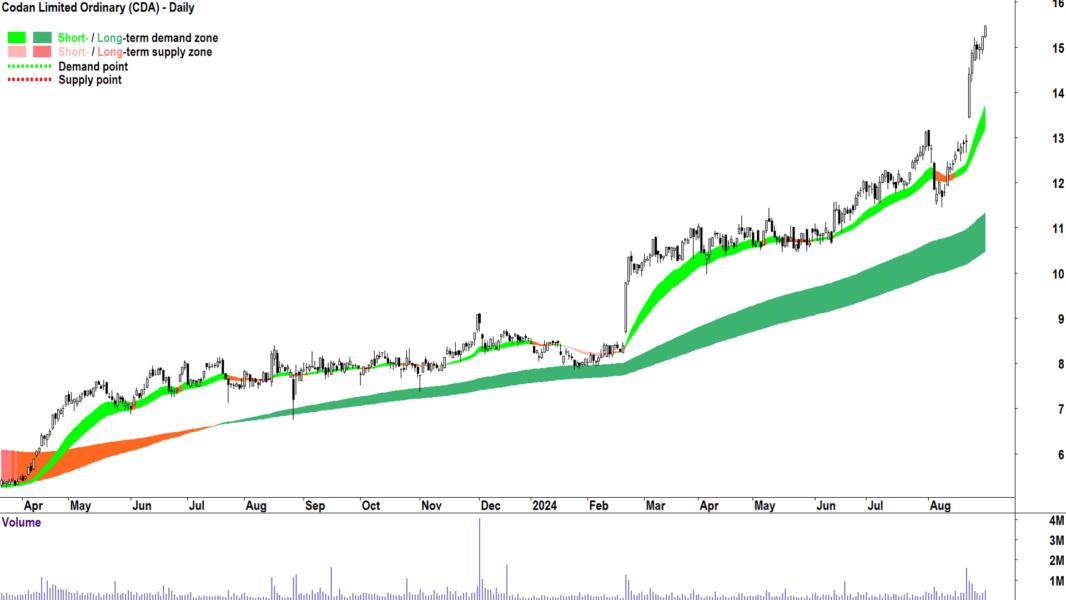
Codan | CDA | $15.48 | +20.8% | +99.0% |
Charter Hall Long Wale Reit | CLW | $3.89 | +8.7% | +11.8% |
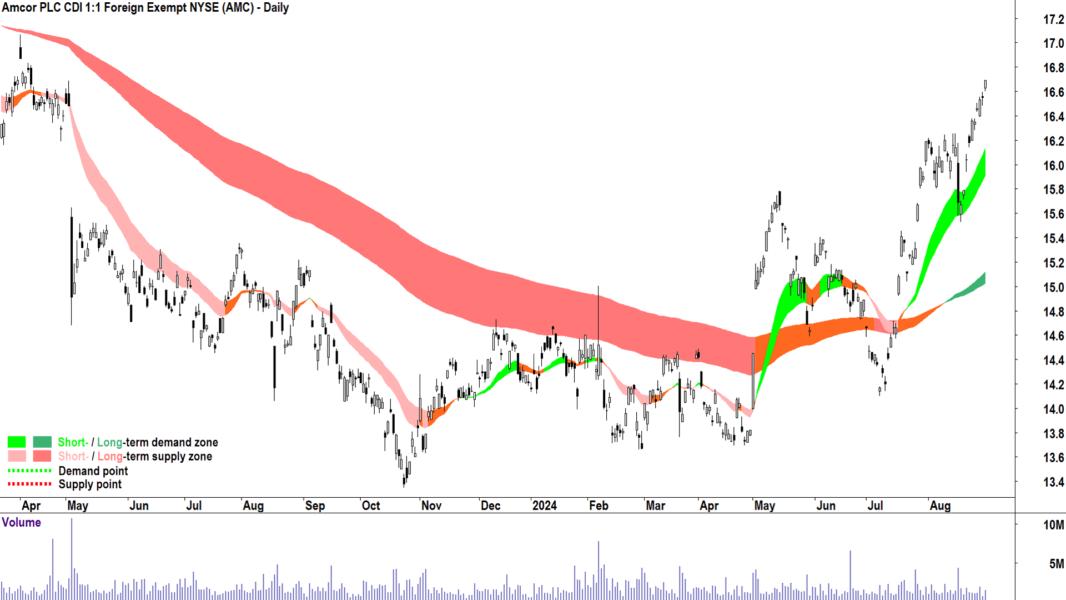
Amcor | AMC | $16.69 | +3.2% | +11.2% |
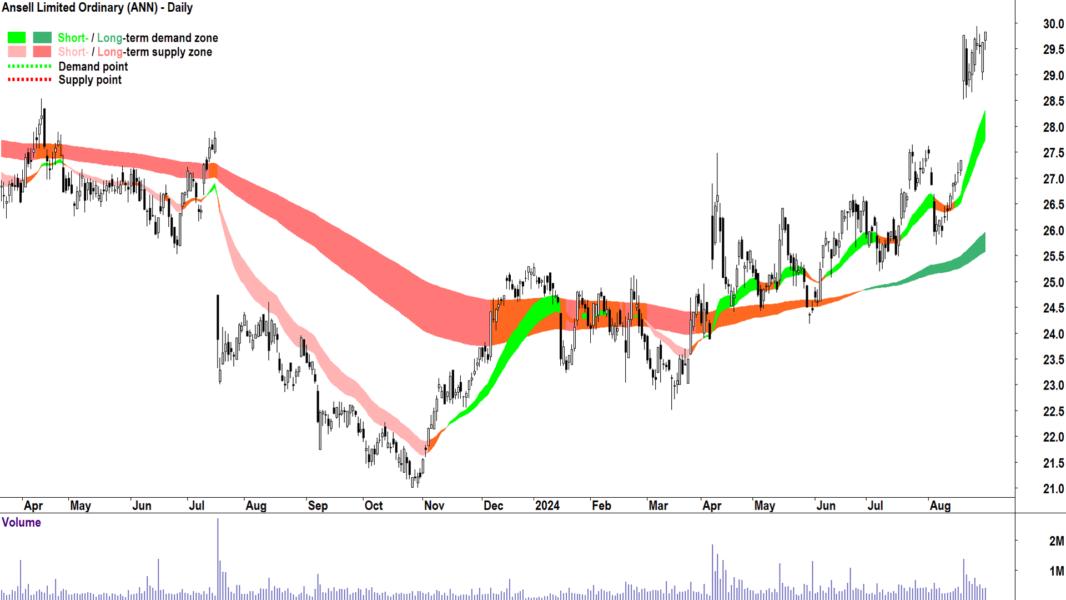
Ansell | ANN | $29.83 | +8.6% | +28.3% |
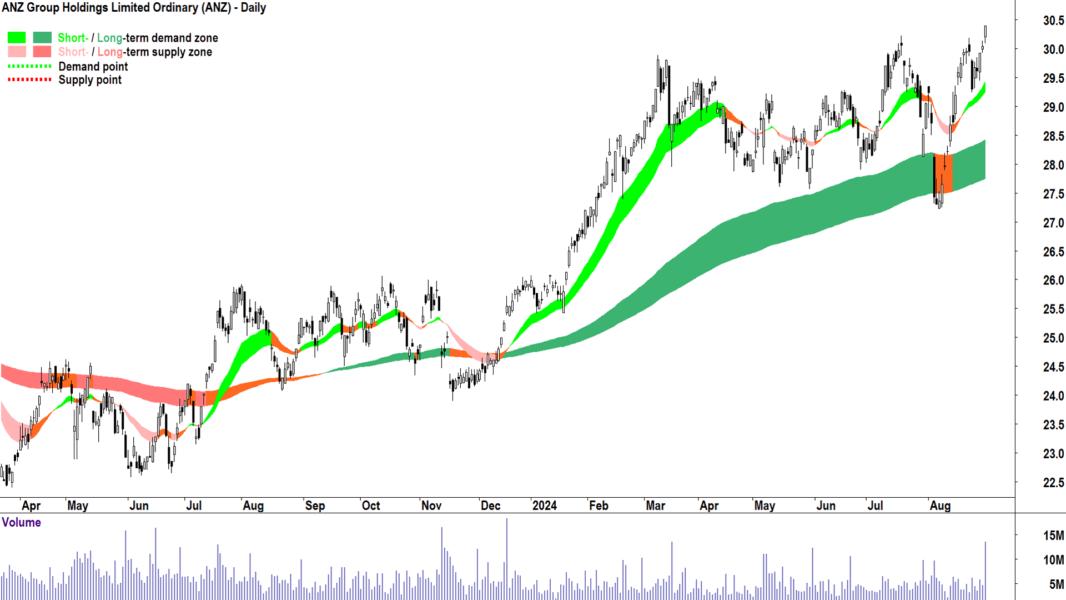
ANZ Group | ANZ | $30.40 | +4.0% | +22.6% |
BetaShares Global Healthcare Hedged ETF | DRUG | $9.12 | +4.0% | +14.9% |
Downer EDI | DOW | $5.59 | +11.6% | +34.4% |
Findi | FND | $4.43 | +17.5% | +795.0% |
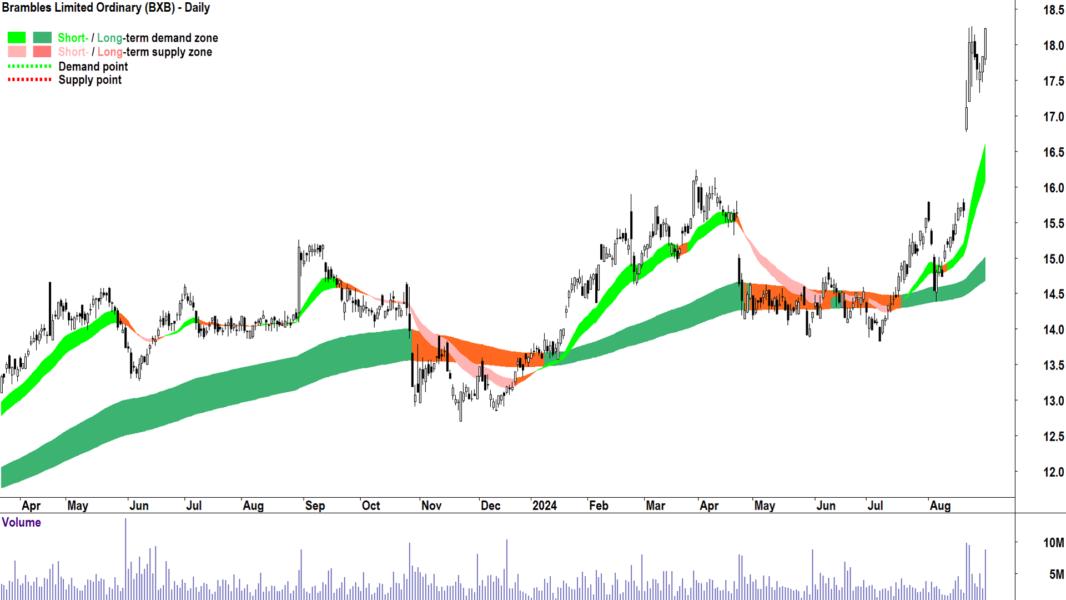
Brambles | BXB | $18.23 | +17.4% | +28.8% |
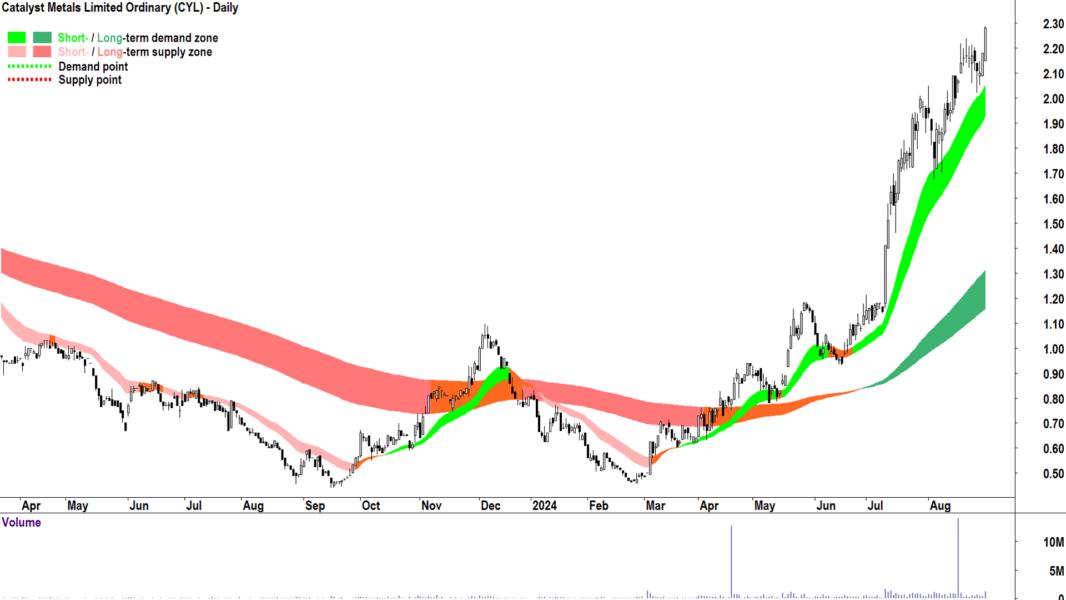
Catalyst Metals | CYL | $2.28 | +17.5% | +365.3% |
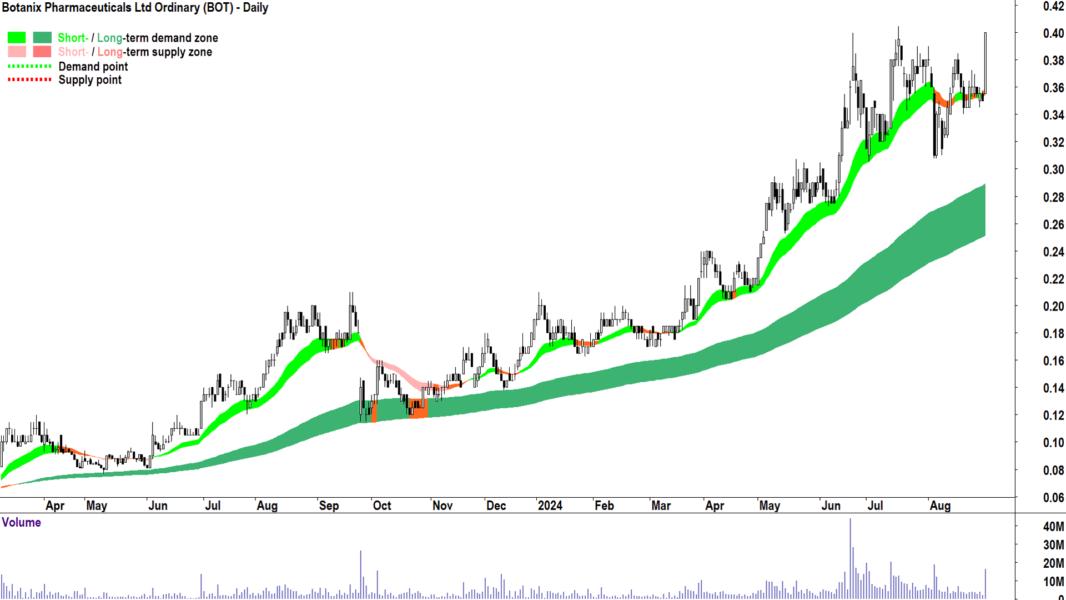
Botanix Pharmaceuticals | BOT | $0.400 | +5.3% | +116.2% |
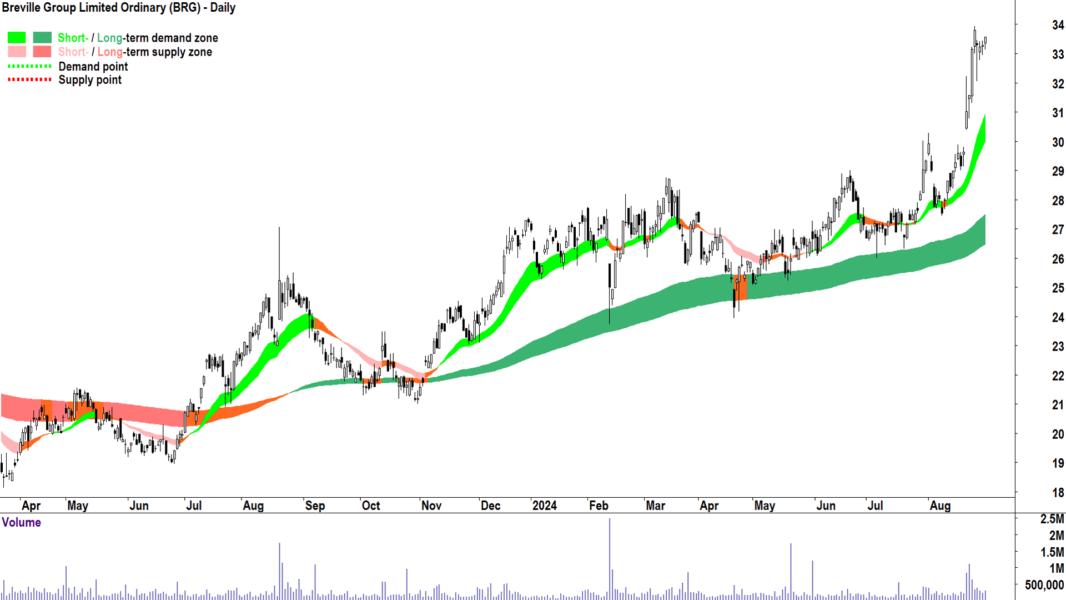
Breville Group | BRG | $33.58 | +12.2% | +37.1% |
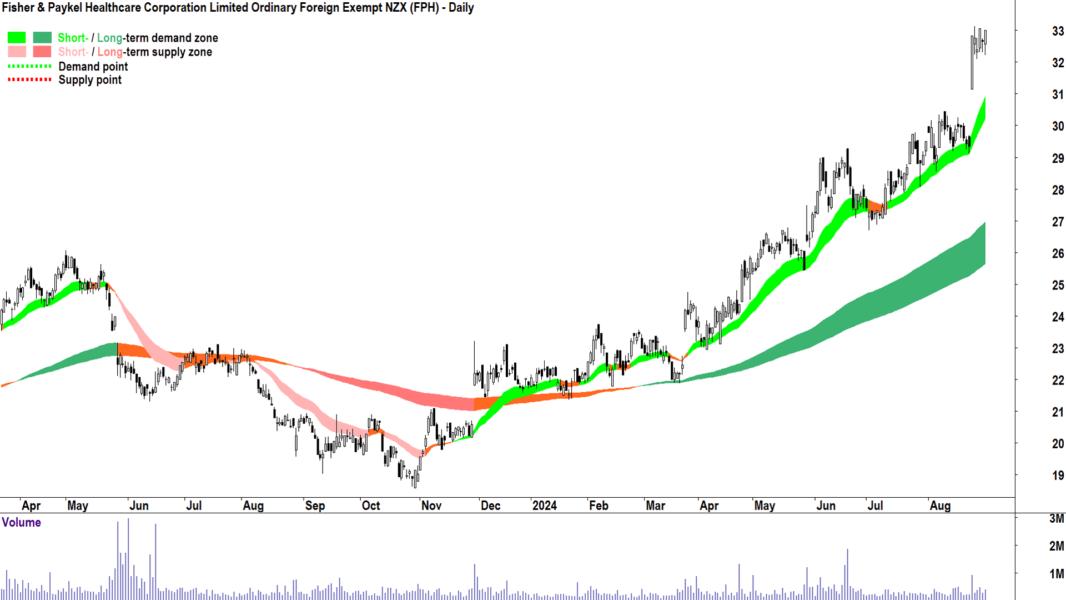
Fisher & Paykel Healthcare Corporation | FPH | $33.01 | +10.8% | +63.2% |
Charter Hall Retail Reit | CQR | $3.64 | +3.7% | +6.4% |
Finbar Group | FRI | $0.980 | +10.1% | +40.0% |
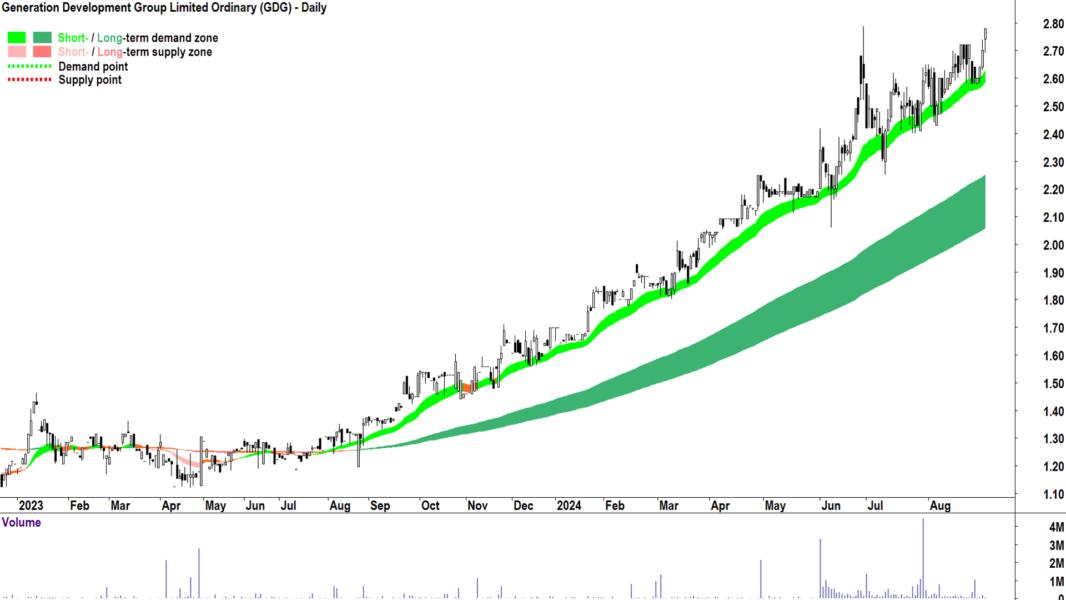
Generation Development Group | GDG | $2.78 | +8.2% | +134.1% |
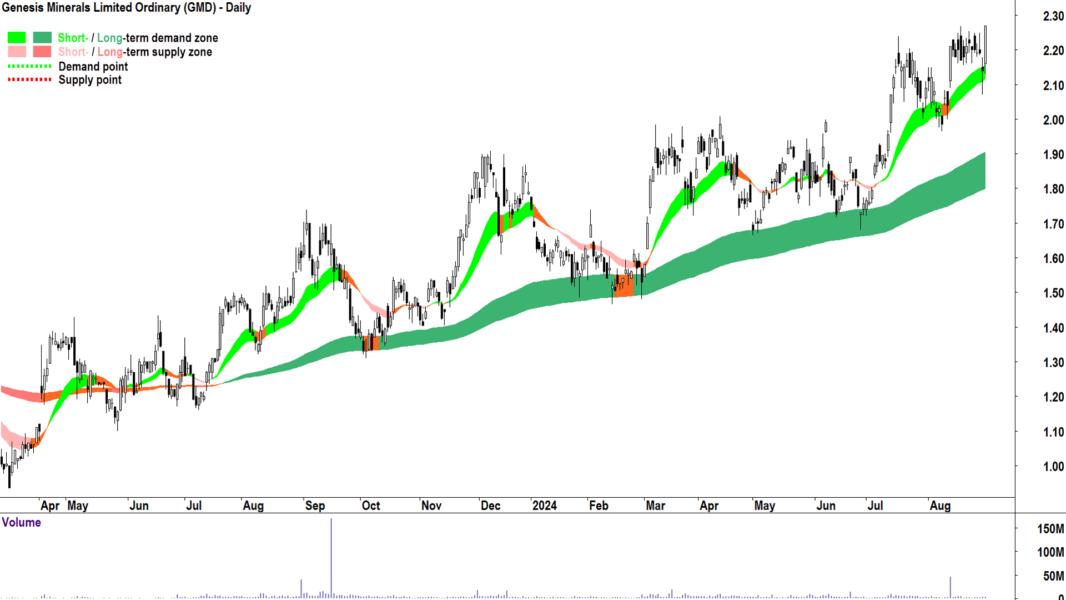
Genesis Minerals | GMD | $2.27 | +7.6% | +45.5% |
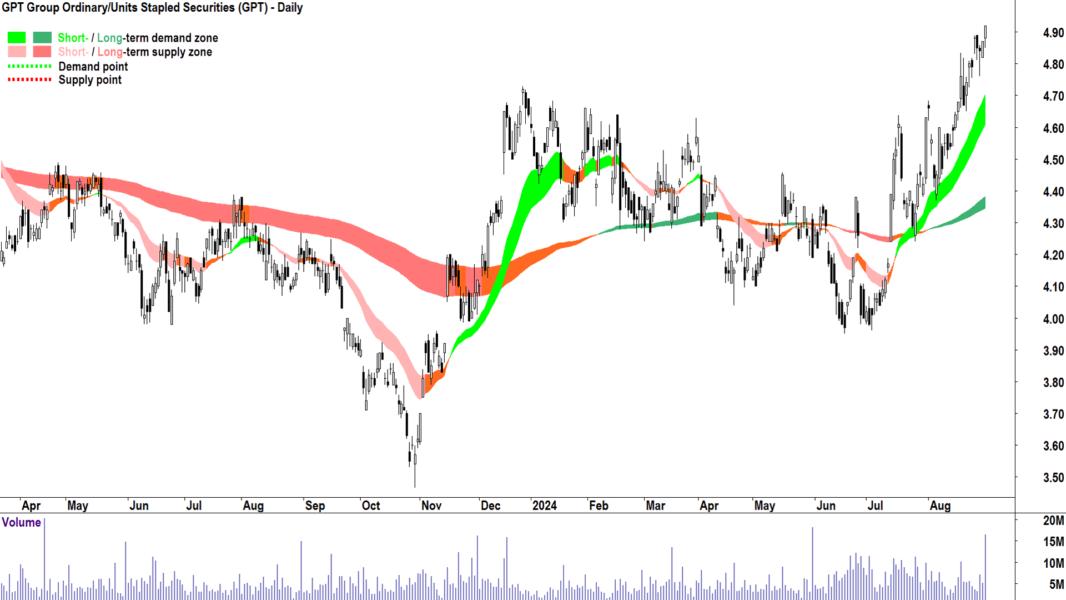
GPT Group | GPT | $4.92 | +5.6% | +18.8% |
HMC Capital | HMC | $8.46 | +5.1% | +58.7% |
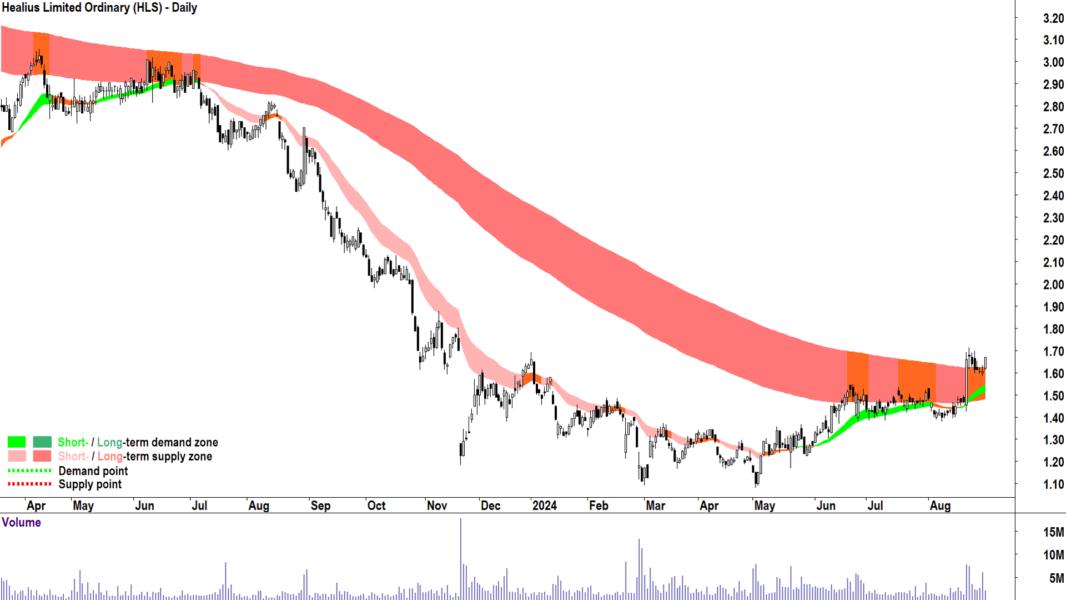
Healius | HLS | $1.670 | +12.5% | -30.9% |
Hotel Property Investments | HPI | $3.46 | +3.0% | +16.1% |
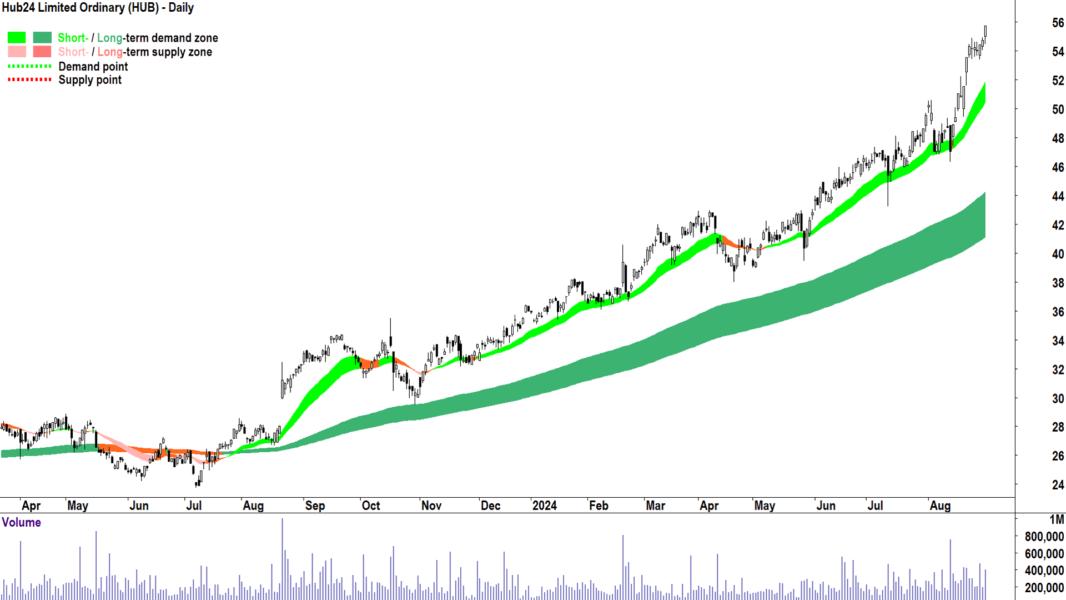
Hub24 | HUB | $55.76 | +11.0% | +74.3% |
Judo Capital | JDO | $1.645 | +15.4% | +78.8% |
Humm Group | HUM | $0.685 | +47.3% | +55.7% |
Insurance Australia Group | IAG | $7.55 | +1.8% | +32.7% |
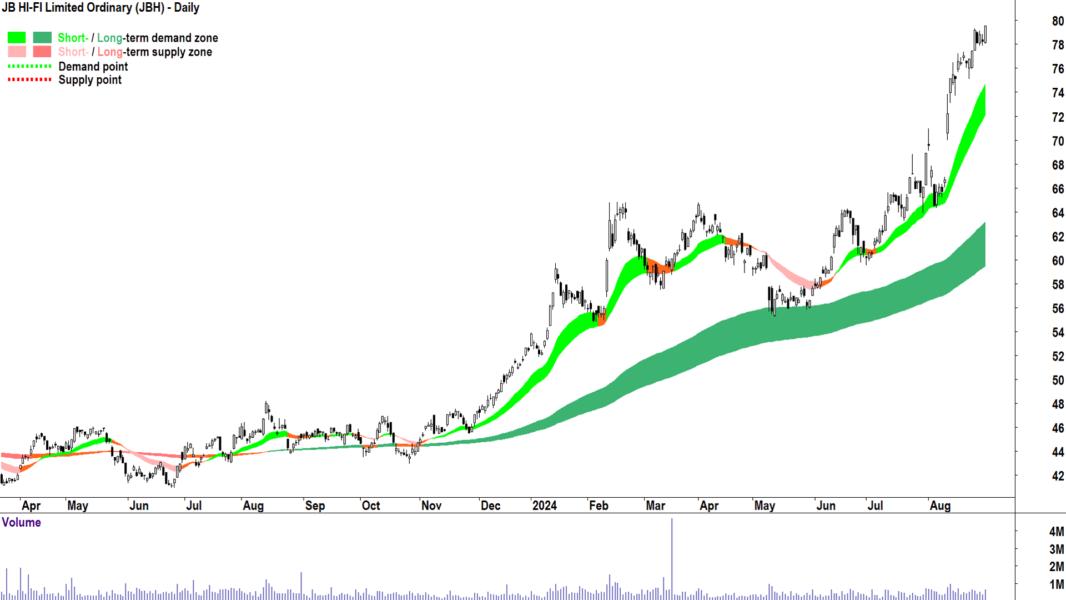
JB HI-FI | JBH | $79.57 | +14.4% | +77.8% |
Mayur Resources | MRL | $0.290 | +20.8% | +61.1% |
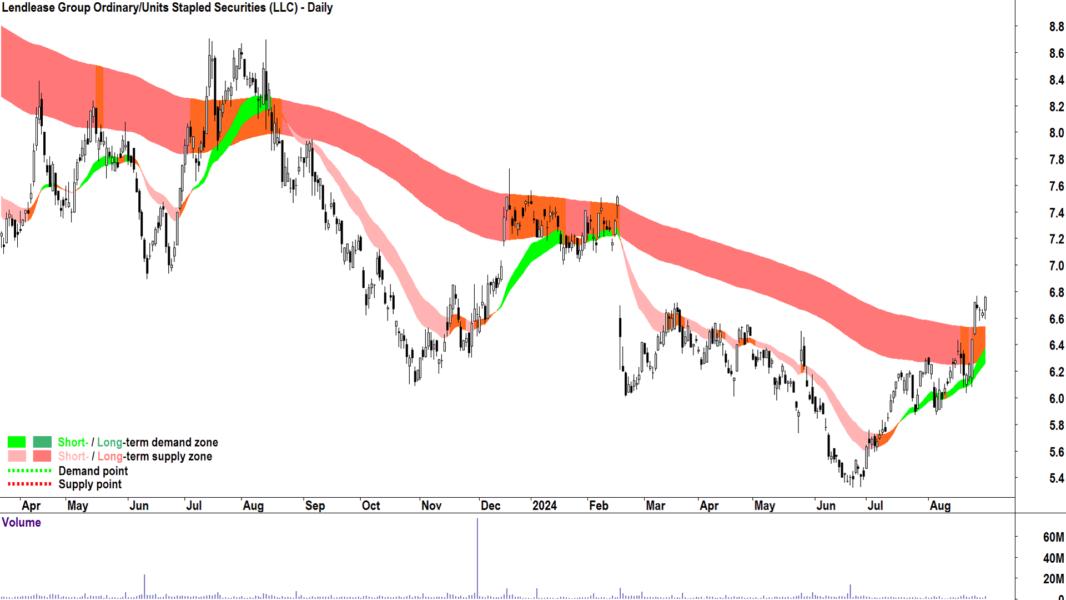
Lendlease Group | LLC | $6.76 | +8.2% | -11.1% |
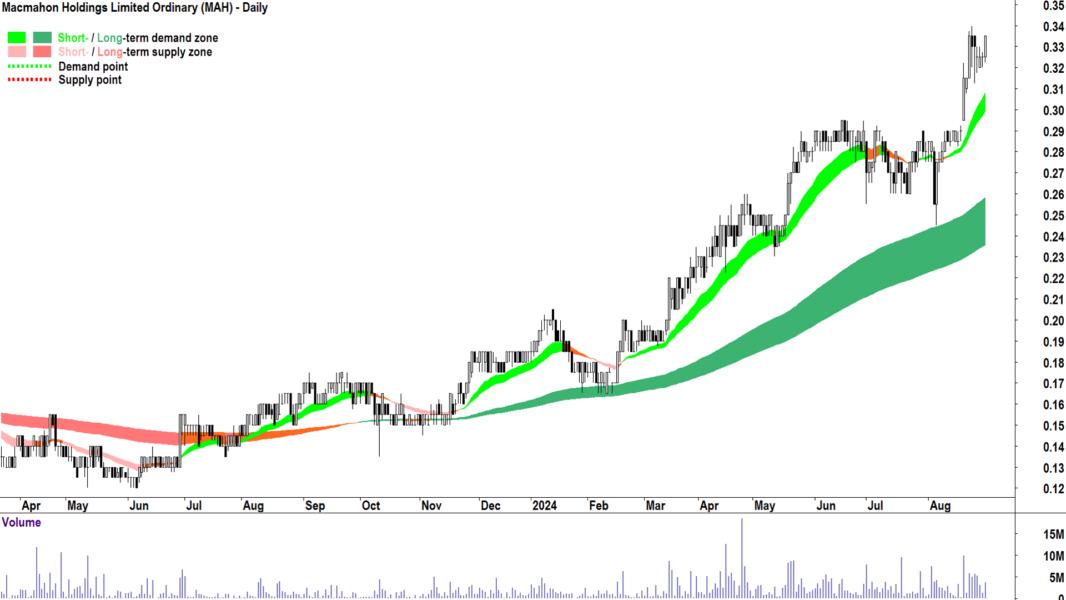
Macmahon | MAH | $0.335 | +17.5% | +109.4% |
Vaneck Australian Banks ETF | MVB | $37.62 | +2.6% | +30.8% |
Northern Star Resources | NST | $15.26 | +7.4% | +31.2% |
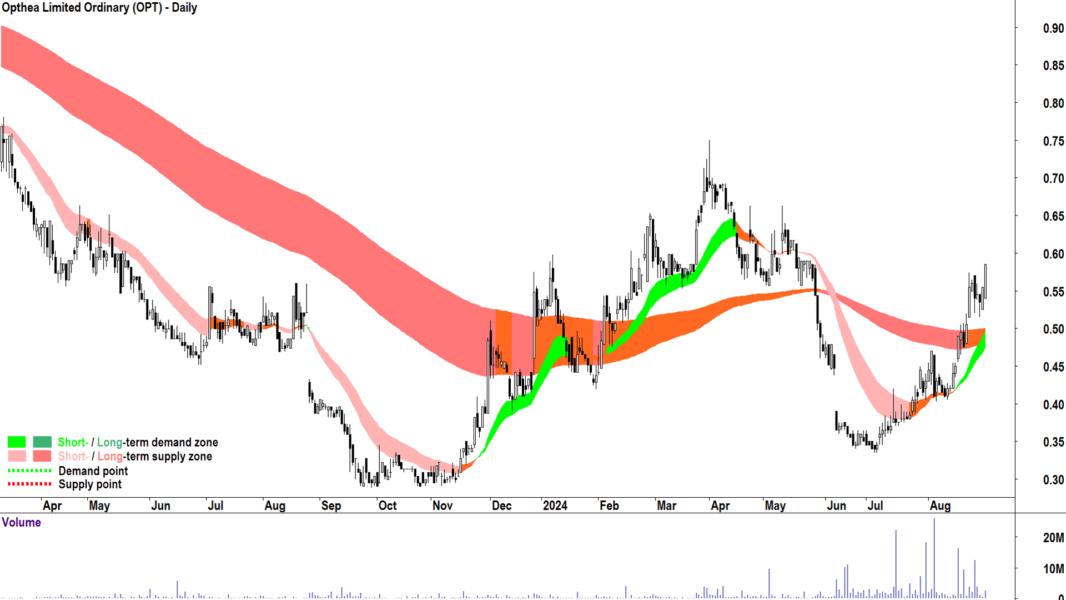
Opthea | OPT | $0.585 | +31.5% | +14.2% |
Pacific Current Group | PAC | $11.40 | +4.6% | +4.4% |
Pinnacle Investment Management Group | PNI | $17.49 | +6.3% | +90.1% |
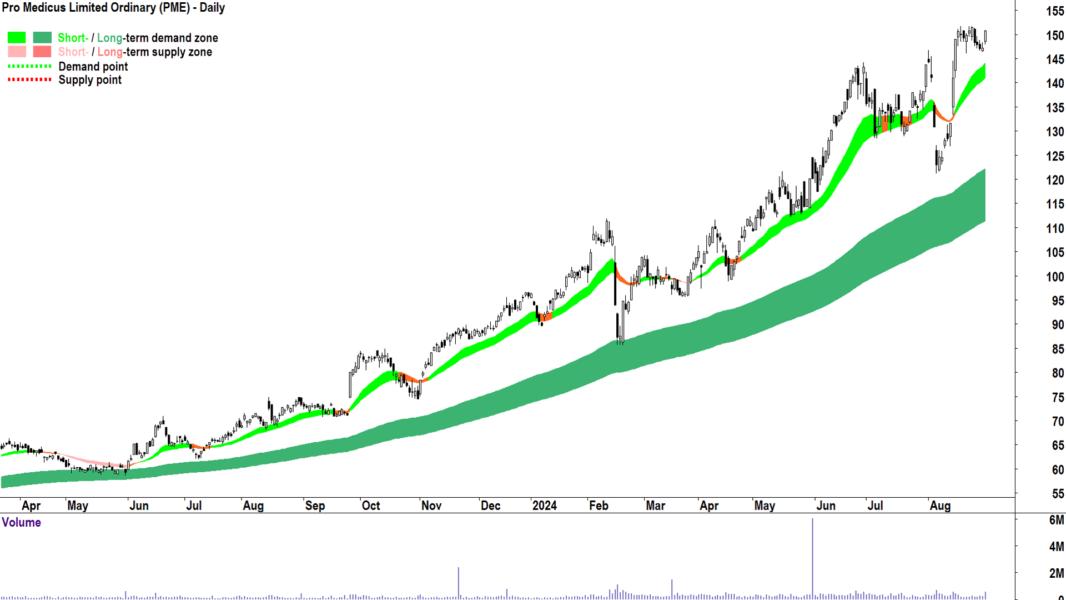
Pro Medicus | PME | $150.70 | +4.4% | +103.4% |
Qantas Airways | QAN | $6.71 | +5.8% | +11.3% |
REA Group | REA | $219.00 | +7.3% | +34.5% |
Rimfire Pacific Mining | RIM | $0.078 | +69.6% | +1200.0% |
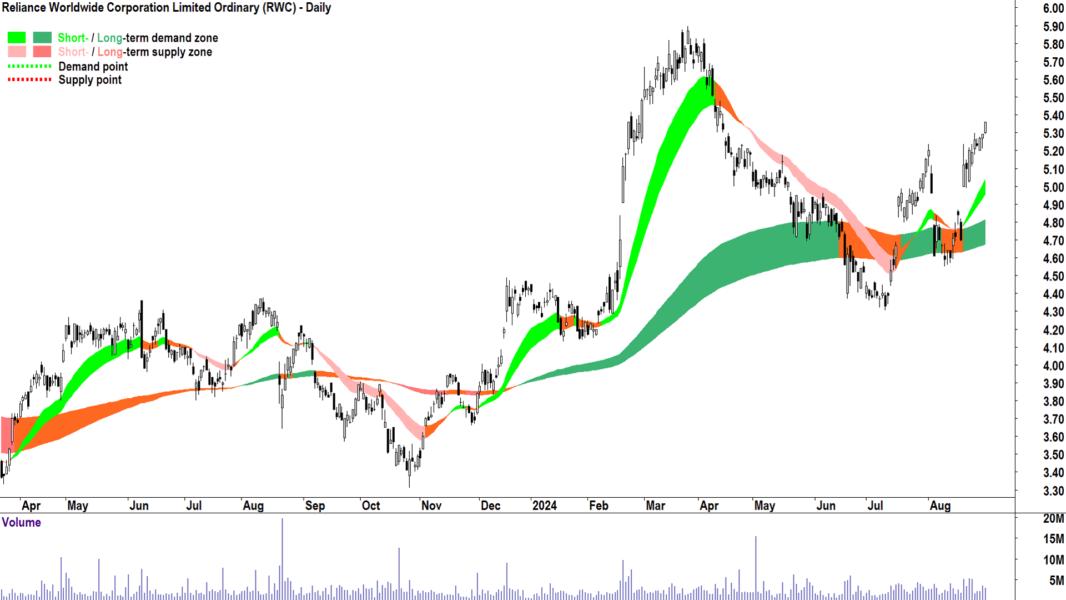
Reliance Worldwide Corporation | RWC | $5.36 | +3.1% | +30.1% |
Reece | REH | $27.34 | -2.4% | +36.6% |
Ramelius Resources | RMS | $2.22 | +13.3% | +70.1% |
Scentre Group | SCG | $3.44 | -1.7% | +26.0% |
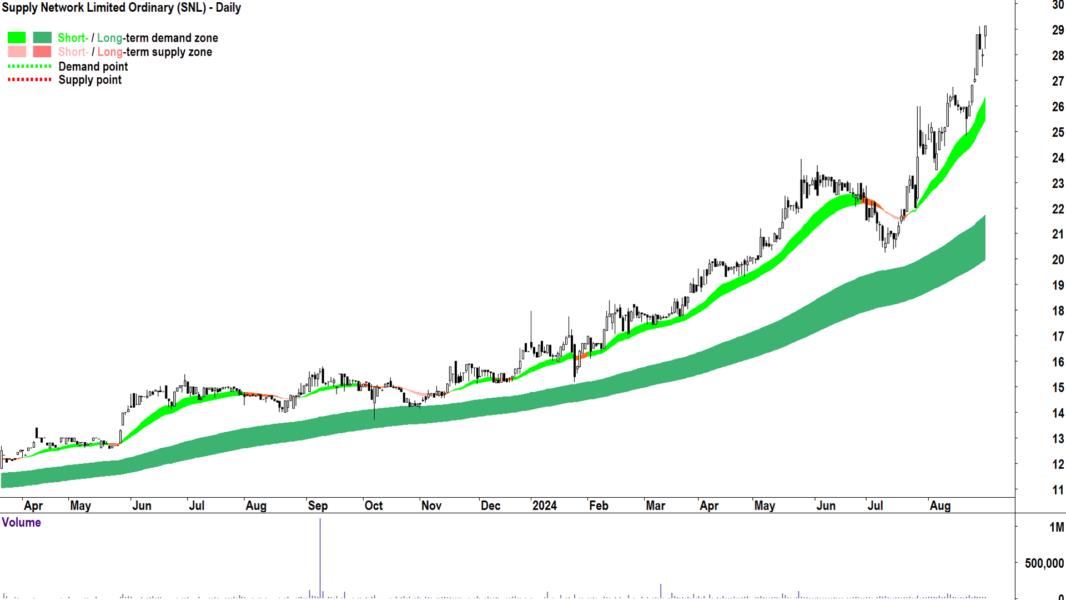
Supply Network | SNL | $29.13 | +17.9% | +99.5% |
Stockland | SGP | $5.02 | +8.9% | +19.2% |
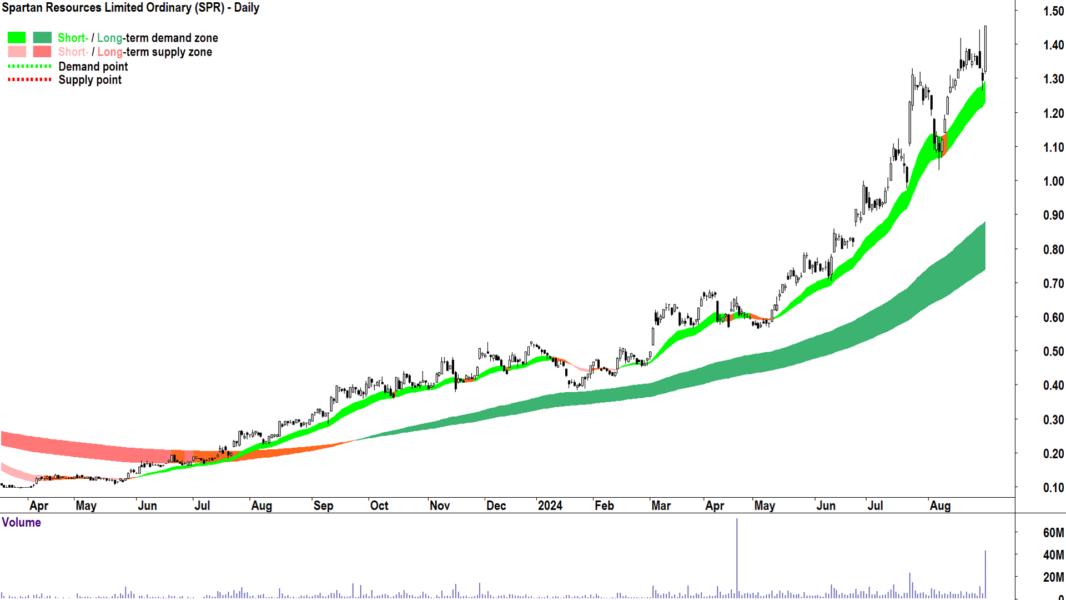
Spartan Resources | SPR | $1.455 | +15.5% | +388.1% |
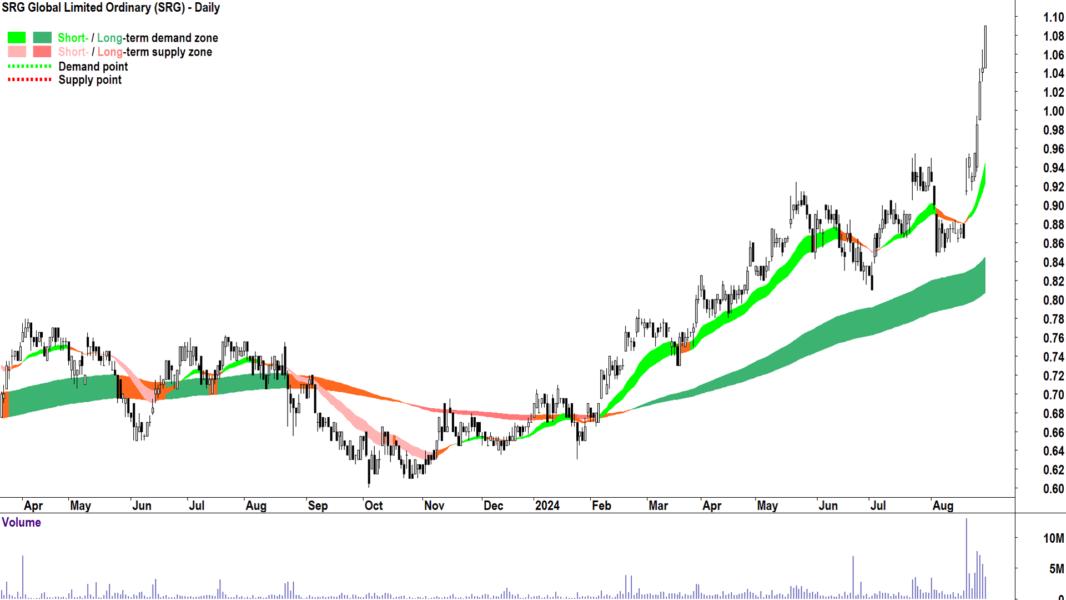
SRG Global | SRG | $1.090 | +16.0% | +60.3% |
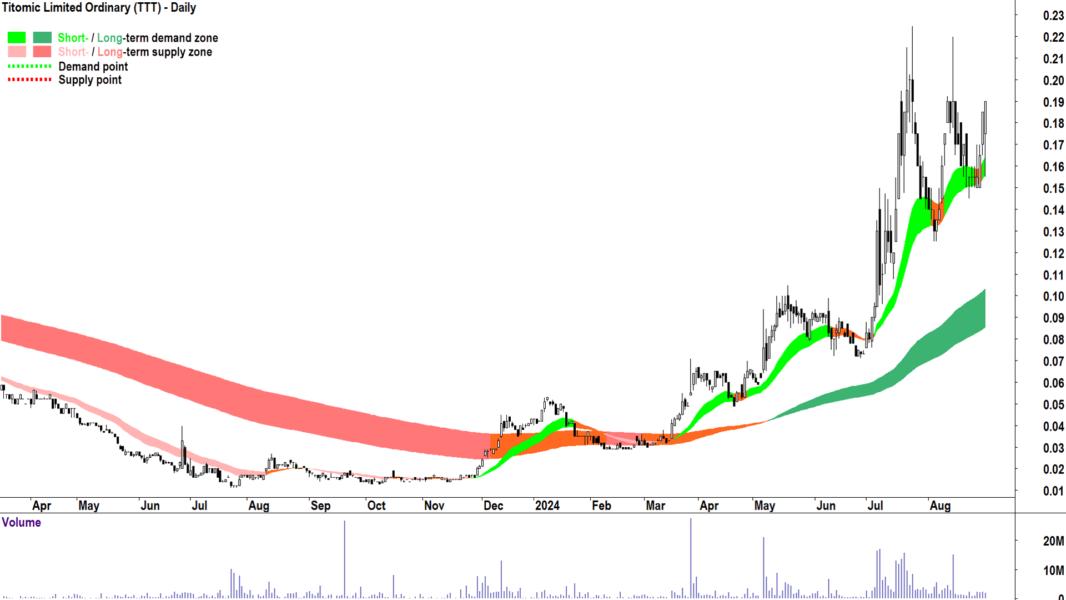
Titomic | TTT | $0.190 | +35.7% | +850.0% |
Super Retail Group | SUL | $17.86 | +11.5% | +41.3% |
Telstra Group | TLS | $3.93 | -0.5% | -2.2% |
Vicinity Centres | VCX | $2.22 | +5.2% | +20.3% |
Westgold Resources | WGX | $3.04 | +14.7% | +96.8% |
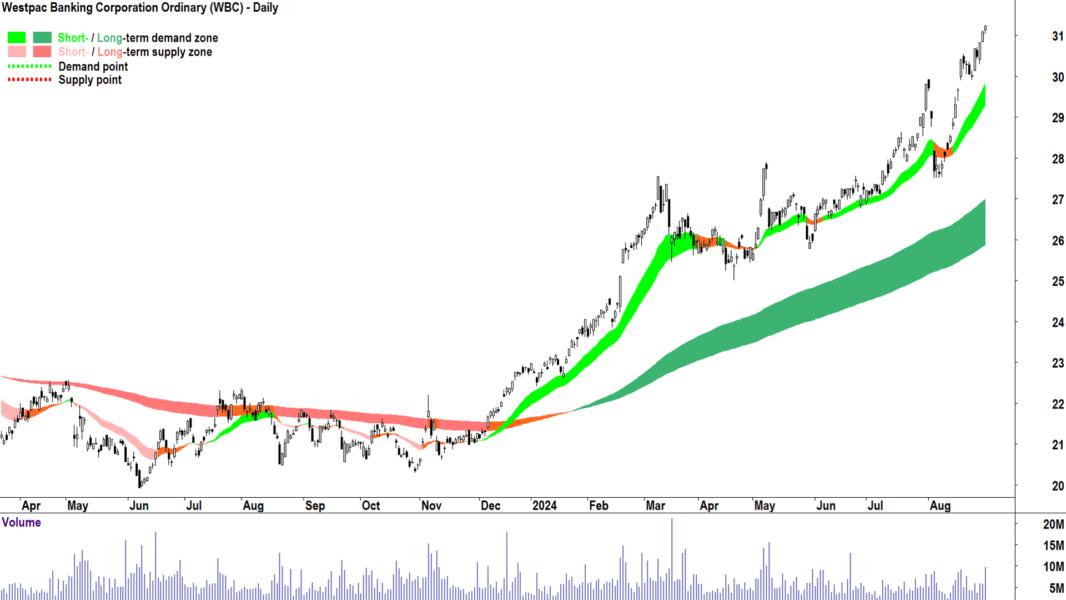
Westpac Banking Corporation | WBC | $31.24 | +5.2% | +45.7% |
Today's Uptrends Scan List
Feature charts from today's Uptrends List 🔎📈
The stocks that I feel are showing the strongest excess demand from today's Uptrends List are: Amcor ![]() AMC, Ansell
AMC, Ansell ![]() ANN, ANZ Group
ANN, ANZ Group ![]() ANZ, Ausgold
ANZ, Ausgold ![]() AUC, Bega Cheese
AUC, Bega Cheese ![]() BGA, Botanix Pharmaceuticals
BGA, Botanix Pharmaceuticals ![]() BOT, Breville Group
BOT, Breville Group ![]() BRG, Brambles
BRG, Brambles ![]() BXB, Codan
BXB, Codan ![]() CDA, Catalyst Metals
CDA, Catalyst Metals ![]() CYL, Fisher & Paykel Healthcare Corporation
CYL, Fisher & Paykel Healthcare Corporation ![]() FPH, Generation Development Group
FPH, Generation Development Group ![]() GDG, Genesis Minerals
GDG, Genesis Minerals ![]() GMD, GPT Group
GMD, GPT Group ![]() GPT, Healius
GPT, Healius ![]() HLS, Hub24
HLS, Hub24 ![]() HUB, JB HI-FI
HUB, JB HI-FI ![]() JBH, Lendlease Group
JBH, Lendlease Group ![]() LLC, Macmahon
LLC, Macmahon ![]() MAH, Opthea
MAH, Opthea ![]() OPT, Pro Medicus
OPT, Pro Medicus ![]() PME, Reliance Worldwide Corporation
PME, Reliance Worldwide Corporation ![]() RWC, Supply Network
RWC, Supply Network ![]() SNL, Spartan Resources SSPR, SRG Global
SNL, Spartan Resources SSPR, SRG Global ![]() SRG, Titomic
SRG, Titomic ![]() TTT, Westpac Banking Corporation
TTT, Westpac Banking Corporation ![]() WBC.
WBC.
Charts below:
Downtrends Scan List
Company | Code | Last Price | 1mo % | 1yr % |
|---|---|---|---|---|
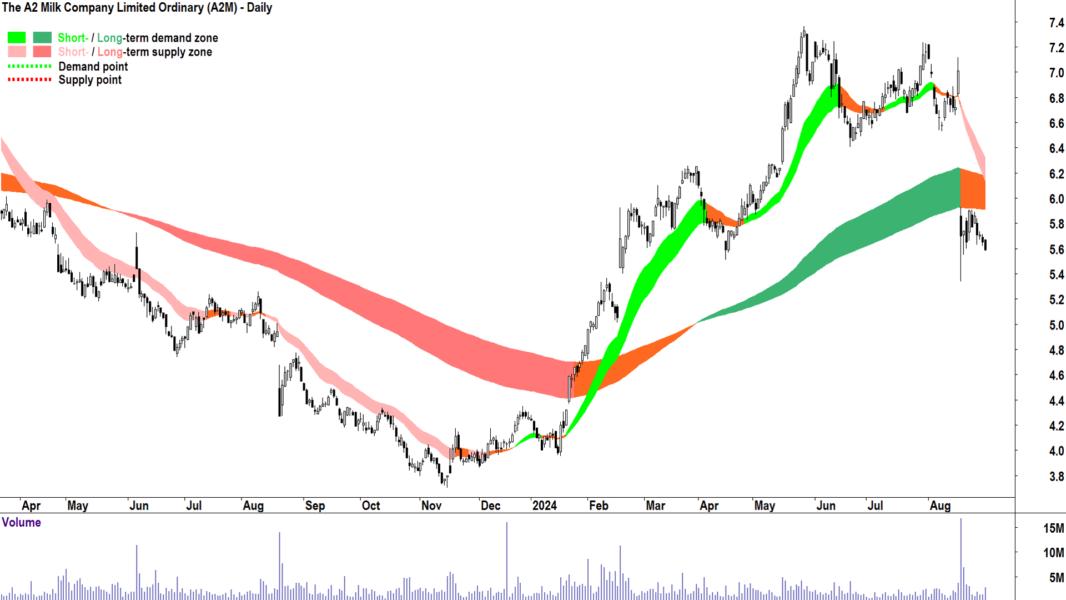
The A2 Milk Company | A2M | $5.59 | -21.4% | +20.2% |
Ampol | ALD | $28.93 | -13.8% | -15.0% |
Bellevue Gold | BGL | $1.265 | -9.3% | -18.7% |
Brainchip | BRN | $0.170 | -10.5% | -47.7% |
Dicker Data | DDR | $9.11 | -11.2% | +8.3% |
Grange Resources | GRR | $0.275 | -12.7% | -33.7% |
Kelsian Group | KLS | $3.76 | -27.6% | -43.3% |
Lifestyle Communities | LIC | $7.72 | -15.7% | -53.6% |
Meteoric Resources | MEI | $0.100 | -4.8% | -45.9% |
Mineral Resources | MIN | $40.15 | -25.4% | -42.2% |
Neuren Pharmaceuticals | NEU | $15.59 | -19.6% | +27.1% |
New Hope Corporation | NHC | $4.48 | -9.1% | -20.0% |
NIB | NHF | $6.26 | -16.8% | -22.5% |
OOH!Media | OML | $1.260 | -13.4% | -14.3% |
Paladin Energy | PDN | $9.79 | -16.0% | +15.9% |
Patriot Battery Metals | PMT | $0.445 | -15.2% | -66.0% |
Perpetual | PPT | $19.65 | -10.2% | -6.3% |
Platinum Asset Management | PTM | $0.995 | -7.0% | -33.9% |
Ramsay Health Care | RHC | $41.55 | -10.5% | -18.9% |
Stanmore Resources | SMR | $3.01 | -18.0% | +7.6% |
Spark New Zealand | SPK | $3.33 | -17.4% | -27.5% |
Santos | STO | $7.22 | -10.2% | -5.1% |
Syrah Resources | SYR | $0.225 | -19.6% | -58.7% |
Tabcorp | TAH | $0.435 | -32.6% | -59.9% |
Talga Group | TLG | $0.435 | +1.2% | -62.8% |
Viva Energy Group | VEA | $2.88 | -11.7% | -7.1% |
Whitehaven Coal | WHC | $6.69 | -14.1% | +1.1% |
Today's Downtrends Scan List
Feature charts from today's Downtrends List 🔎📉
The stocks that I feel are showing the strongest excess supply from today's Downtrends List are: The A2 Milk Company ![]() A2M, Ampol
A2M, Ampol ![]() ALD, Dicker Data
ALD, Dicker Data ![]() DDR, Paladin Energy
DDR, Paladin Energy ![]() PDN, Patriot Battery Metals
PDN, Patriot Battery Metals ![]() PMT, Ramsay Health Care
PMT, Ramsay Health Care ![]() RHC, Spark New Zealand
RHC, Spark New Zealand ![]() SPK, Tabcorp
SPK, Tabcorp ![]() TAH.
TAH.
Charts of each below:
ChartWatch ASX Scans Criteria
Criteria for Uptrends List
Short term uptrend (ST trend ribbon is light green)
Long term uptrend or long term trend is transitioning from down to up (LT trend ribbon is dark green, or LT trend ribbon is amber and contracting)
Demand-side price action (rising peaks and rising troughs is preferred, but based upon weight of evidence of other criteria rising peaks only or rising troughs only may be permitted)
Predominance of demand-side candles (i.e., white bodies and or downward pointing shadows)
The last candle in particular is a strong demand-side candle
Criteria for Downtrends List
Short term downtrend (ST trend ribbon is light pink)
Long term downtrend or long term trend is transitioning from up to down (LT trend ribbon is dark pink, or LT trend ribbon is amber and contracting)
Supply-side price action (falling peaks and falling troughs is preferred, but based upon weight of evidence of other criteria falling peaks only or falling troughs only may be permitted)
Predominance of supply-side candles (i.e., black bodies and or upward pointing shadows)
The last candle in particular is a strong supply-side candle
Important considerations when using the ChartWatch ASX Scan Lists:
1. The future is unknown. Anything can happen to change the trends in the lists above. A stock in a perfect uptrend or downtrend may not remain that way by the close of trading today. 2. These lists are not exhaustive, they are curated by Carl. You will find that certain stocks might not appear in a particular list on consecutive days but might reappear when Carl feels it deserves to return to the list. 3. This is not a recommendation service, merely an aid to help you better understand the workings of Carl’s technical analysis model in a practical way. Carl will not alert you to stocks that have dropped off a list because their trend has changed – it is up to you to apply the criteria to determine why a particular stock might not still be included. 4. This is general, educational information only – always do your own research.