Big fund managers hate CBA because it's "overvalued", but the trend is your friend!
- Interesting uptrends in today's Scans: Commonwealth Bank of Australia (CBA), Shape Australia Corporation (SHA), Ventia Services Group (VNT), Vanguard US Total Market Shares Index ETF (VTS).
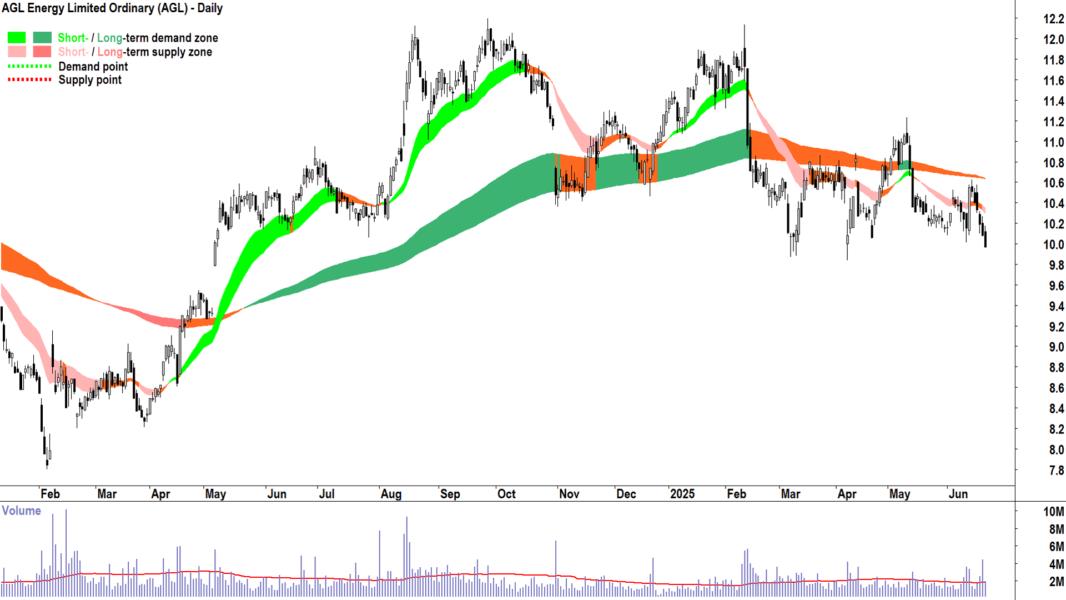
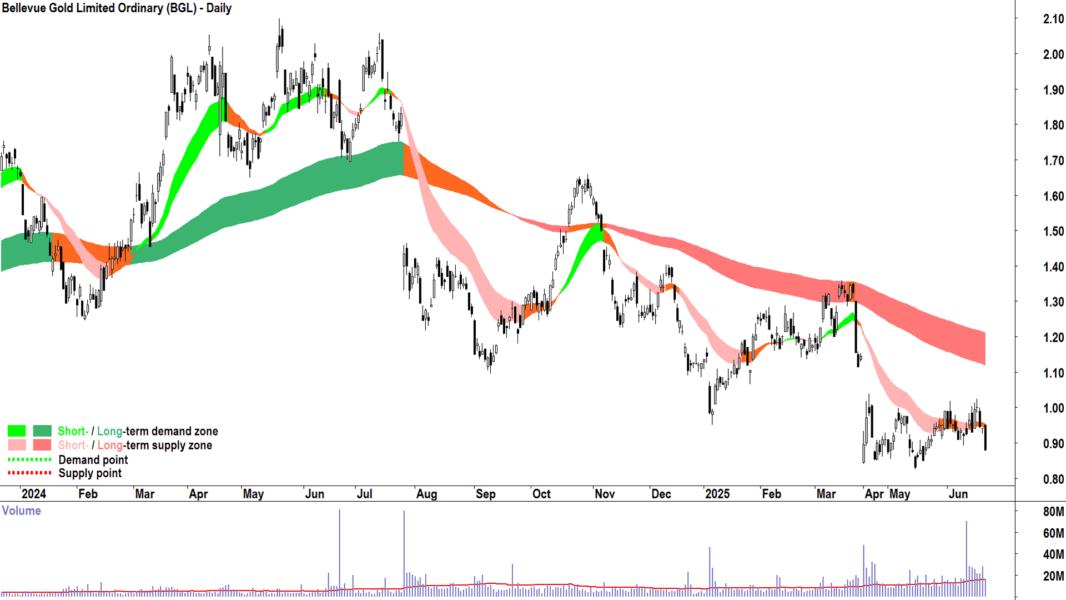
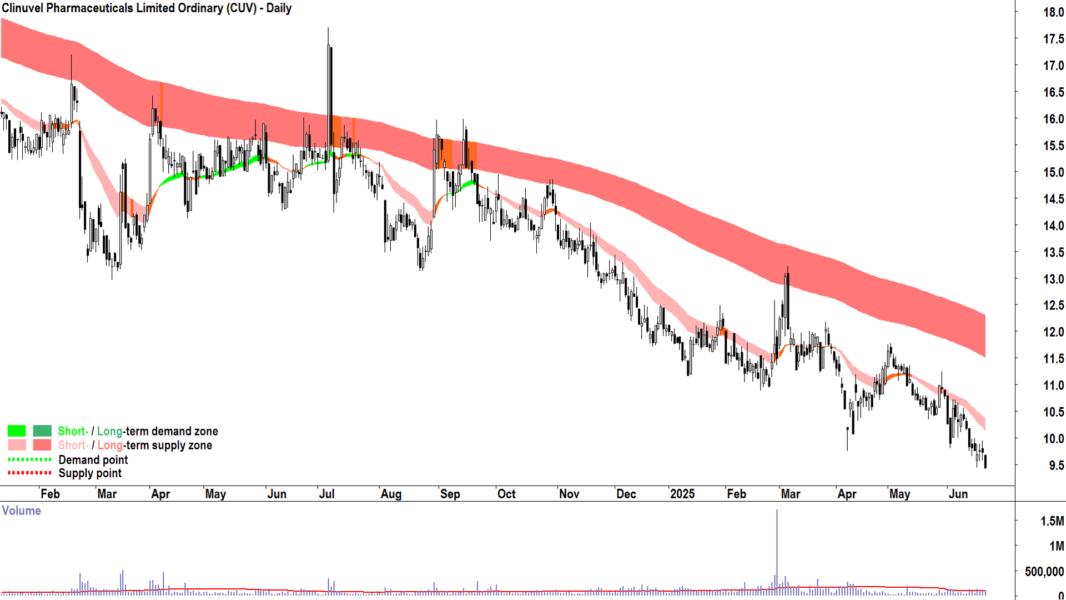
- Interesting downtrends in today's Scans: AGL Energy (AGL), Bellevue Gold (BGL), Clinuvel (CUV), Guzman y Gomez (GYG), IDP Education (IEL), Iluka Resources (ILU), Kogan.Com (KGN), Mesoblast (MSB), Novonix (NVX), South32 (S32), Syrah Resources (SYR).
I asked ChatGPT to find me a dozen articles where a fund manager or investment expert describes Commonwealth Bank of Australia (CBA) as "overvalued". This is what it came up with:
Certainly! Here’s a concise list of 12 media articles where Commonwealth Bank of Australia ![]() CBA is described as overvalued or similarly by fund managers or investment experts:
CBA is described as overvalued or similarly by fund managers or investment experts:
🔎 CBA Overvaluation Commentary – Expert Sources
Financial Times Jun 19, 2025 – Rupert Mitchell: “This surge is not fully supported by fundamentals.”
News.com.au Jun 8, 2025 – Alan Hull: “Smart money is not buying CBA — it’s seriously overvalued.”
Stocks Down UnderJun 6, 2025 – Nick Sundich: “Analysts covering the company say it is overvalued… target price implies a ~40% discount.”
InvestorDaily May 20, 2025 – Paul Moore: “Super fund behaviour has inflated CBA’s price beyond logic.”
Livewire Markets May 29, 2025 – Simon Mawhinney: “I’d rather stick pins in my eyes than buy CBA.”
Wilson Asset Management / Morningstar May 2025 – Matthew Haupt: “Most expensive bank in the world… valuation unjustifiable.”
Motley Fool Australia Jan 16, 2025 – Firetrail Investments: “CBA is 30% overvalued… valuation compression likely.”
Reuters Feb 10, 2025 – Unnamed analyst: “Trades at 26× forward earnings, more than double peers.”
Plato Investment Management Dec 2024 – Dr Don Hamson: “Trading at growth multiples without growth… 3.5× P/B, 28× P/E.”
Livewire Markets Jul 2024 – Greg Canavan: “It’s all about ‘multiple expansion’.”
Market Index Jul 16, 2024 – L1 Capital: “Most expensive valuation ever… ~60% premium to peers.”
The Australian Oct 2024 – Phil King: “CBA’s valuation is unsustainable.”
Yep, I know, No. 11 is from Market Index (hey – not one of mine! 😁).
My personal favourite is "I’d rather stick pins in my eyes than buy CBA". Ouch! Sounds painful!
Why does CBA get the fundies so worked up!? Well for one, because they believe the stock is so overvalued most fundies are perilously underweight, which makes it harder for them to beat the index and meet their return goals.
But why must investing be such a battle with reality? After all, you know my philosophy on investing is: "The less I know about a company, the better I tend to trade it."
So, if I have no idea whether a stock is cheap, expensive, has a moat, or is trading with X margin of safety (that old chestnut!), why would I sell it just because the price has gone up?
Like CBA's has. Immensely too, mind you (and probably to the delight of millions of average Aussie shareholders who wouldn't have a clue what the valuation is or isn't but have held on!).
Nope, I'm a very simple, you could say – single brain celled organism – when it comes to my investing:
If it's going up...that means there's more demand than supply...I don't need to understand why...it just is...I want to own it 📈 = 👍.
If it's going down...that means there's more supply than demand...I don't need to understand why...it just is...I want to sell, avoid, or short sell it 📉 = 👎.
Can I point out two of my favourite charts on the ASX now and for these last 13 months that ChartWatch ASX Scans has been bringing you the very best uptrends and downtrends the Aussie stock market has to offer 💪:
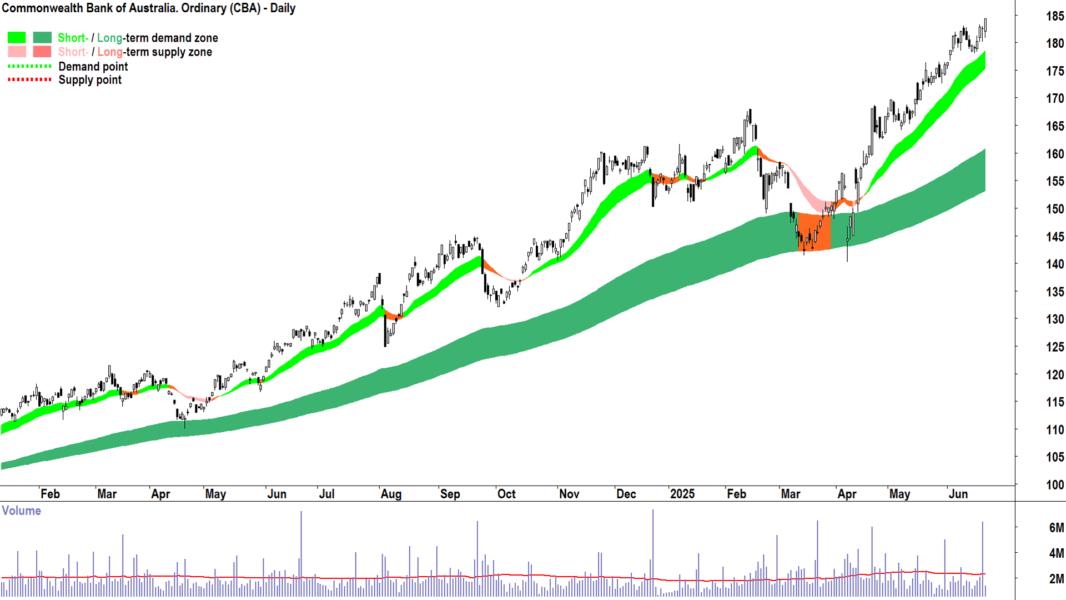
1. Commonwealth Bank of Australia (CBA)
It's going up because D > S 📈 = 👍
I don't know why 🤔
I don't care why 🤷
Feature Uptrend in today's update for the 60th time since ChartWatch ASX Scans started in May last year (an average of more than once a week CBA has been one of my highest conviction uptrends – more than any other ASX company) 💯✅
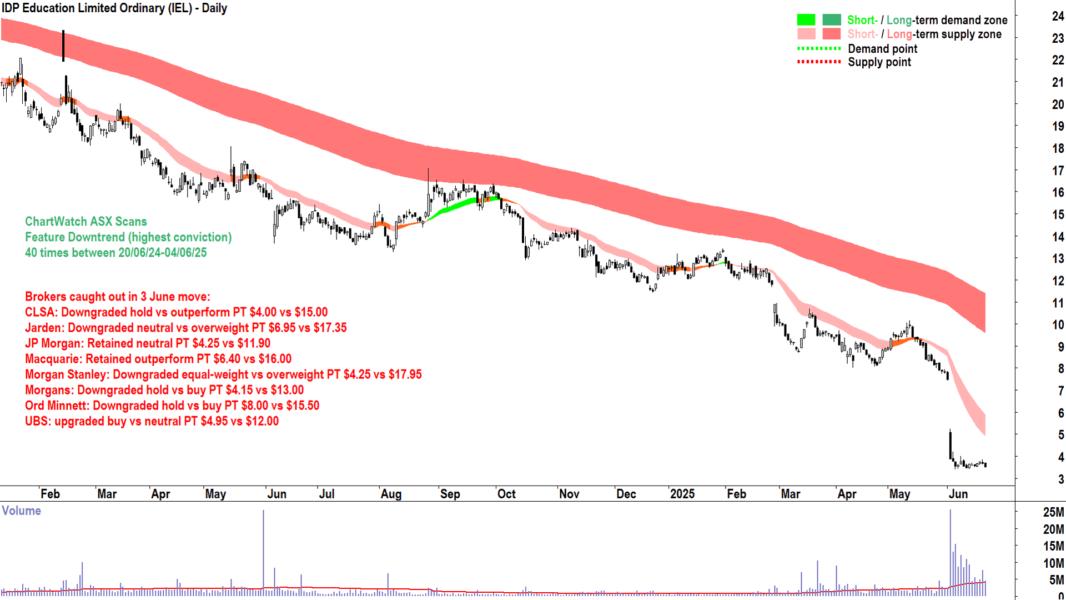
2. IDP Education (IEL)
It's going down because S > D 📉 = 👎
I don't know why 🤔
I don't care why 🤷
Feature Downtrend in today's update for the 43rd time since ChartWatch ASX Scans started in May last year 💯✅
Will I still be right on CBA and IEL in 12 months time and the fund managers wrong...or vice versa? I don't know. I don't care, either. And I certainly won't be sticking any pins in my eyes if I'm wrong! 😁
Welcome to my ChartWatch Daily ASX Scans series. Here I present scan lists based on my trend following technical analysis methodology. My goal is to alert you to the best uptrends and downtrends on the ASX.
Feel free to get your favourite AI to convert the tables below into lists you can upload to your favourite trading platform like TradingView. Then you'll be able to skip from chart to chart and quickly and easily see the best uptrends and downtrends on the ASX.
Some investors prefer to buy those stocks in strong uptrends, and avoid, sell, or short sell those stocks in strong downtrends – but how you use the lists is really up to you!
Note, many stocks in both lists have appeared there many times before. As long as they keep meeting my criteria – they'll keep appearing. But note, there won't be any notifications when they don't, so you'll have to do your own research on when a particular trend changes!
Uptrends Scan List
Company | Code | Last Price | 1mo % | 1yr % |
Autosports Group | ASG | $2.23 | +5.7% | +3.7% |
Brazilian Rare Earths | BRE | $2.36 | +23.6% | -25.8% |
Commonwealth Bank of Australia | CBA | $184.35 | +6.7% | +45.2% |
Clover Corporation | CLV | $0.545 | +19.8% | +10.1% |
Cedar Woods Properties | CWP | $6.91 | +5.3% | +50.2% |
Ishares Emerging Markets Ex China ETF | EMXC | $28.42 | +3.3% | 0% |
Green Critical Minerals | GCM | $0.024 | +100.0% | +300.0% |
Goodman Group | GMG | $34.59 | +8.2% | -3.0% |
GR Engineering Services | GNG | $3.28 | +13.5% | +49.8% |
Genusplus Group | GNP | $3.60 | +9.4% | +96.7% |
iShares MSCI South Korea ETF | IKO | $109.87 | +17.0% | +7.4% |
Global X Semiconductor ETF | SEMI | $18.00 | +8.2% | -7.4% |
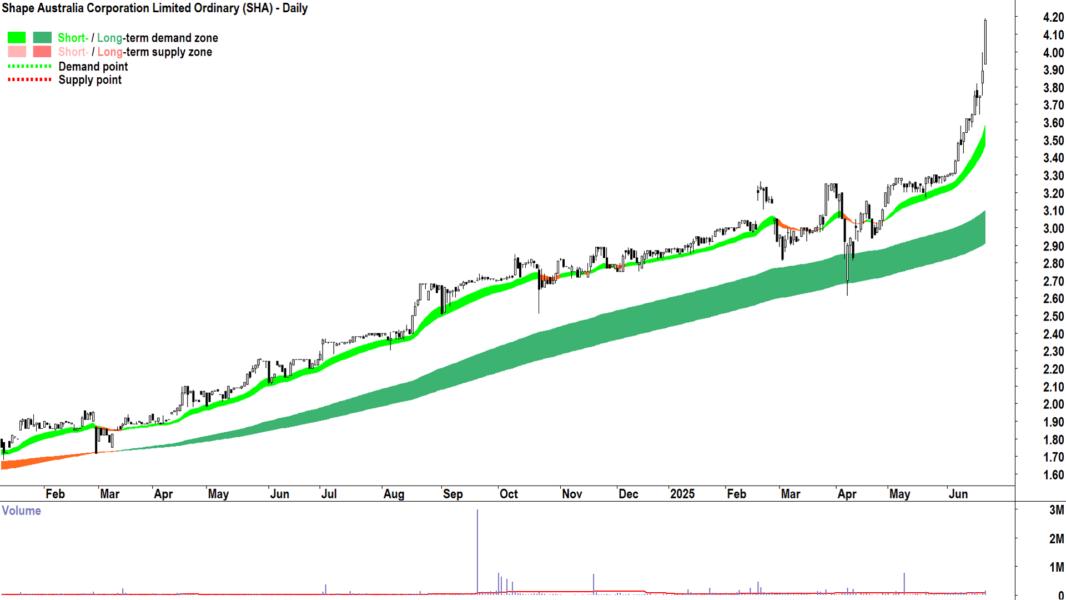
Shape Australia Corporation | SHA | $4.18 | +27.1% | +85.8% |
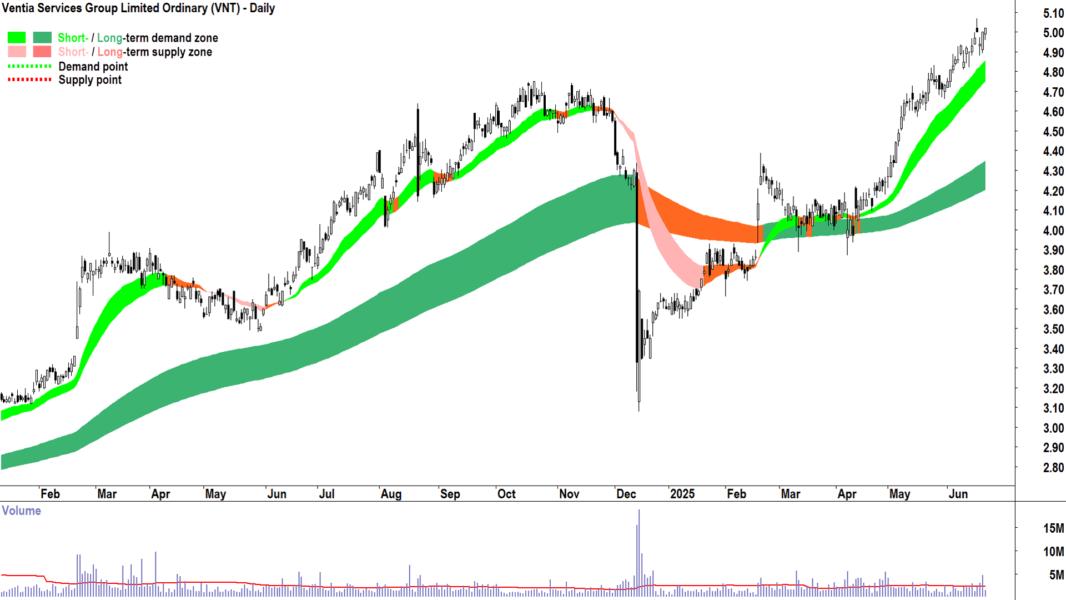
Ventia Services Group | VNT | $5.02 | +5.5% | +33.2% |
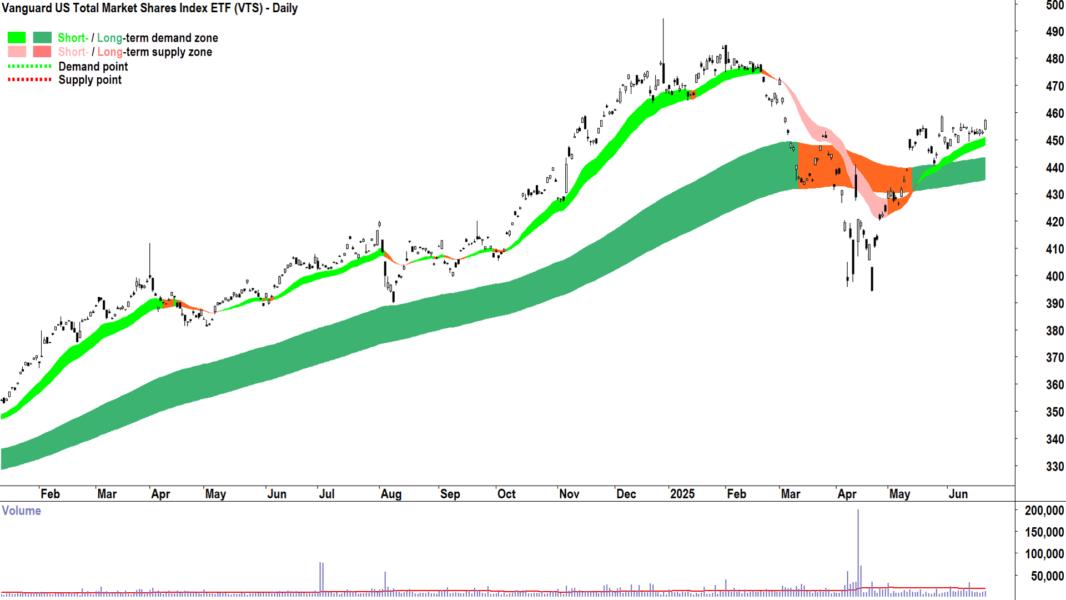
Vanguard US Total Market Shares Index ETF | VTS | $457.03 | +2.5% | +13.0% |
Xero | XRO | $193.46 | +7.5% | +47.8% |
Today's Uptrends Scan List
Feature Charts from today's Uptrends List 🔎📈
The stocks that I feel are showing the strongest excess demand from today's Uptrends List are: Commonwealth Bank of Australia ![]() CBA, Shape Australia Corporation
CBA, Shape Australia Corporation ![]() SHA, Ventia Services Group
SHA, Ventia Services Group ![]() VNT, Vanguard US Total Market Shares Index ETF
VNT, Vanguard US Total Market Shares Index ETF ![]() VTS.
VTS.
Feature Uptrend Charts below:
Downtrends Scan List
Company | Code | Last Price | 1mo % | 1yr % |
4DMEDICAL | 4DX | $0.245 | -2.0% | -61.4% |
Acrow | ACF | $0.955 | -6.4% | -14.0% |
AGL Energy | AGL | $9.97 | -2.4% | -4.7% |
Austin Engineering | ANG | $0.310 | -10.1% | -46.1% |
Appen | APX | $0.970 | -15.7% | +98.0% |
Bellevue Gold | BGL | $0.880 | -3.3% | -54.4% |
BHP Group | BHP | $35.64 | -7.7% | -16.6% |
Brainchip | BRN | $0.190 | -13.6% | -11.6% |
Champion Iron | CIA | $3.95 | -10.8% | -39.6% |
Clinuvel Pharmaceuticals | CUV | $9.44 | -10.6% | -37.7% |
Flight Centre Travel Group | FLT | $12.12 | -7.8% | -39.0% |
G8 Education | GEM | $1.155 | -9.4% | -1.3% |
Guzman y Gomez | GYG | $28.72 | -7.7% | 0% |
Healthco Healthcare and Wellness Reit | HCW | $0.735 | -11.4% | -35.0% |
Helloworld Travel | HLO | $1.325 | -14.5% | -40.6% |
Healius | HLS | $0.730 | -26.6% | -33.1% |
Humm Group | HUM | $0.430 | -9.5% | +6.2% |
IDP Education | IEL | $3.52 | -59.0% | -77.4% |
Iluka Resources | ILU | $3.42 | -12.8% | -46.1% |
Immutep | IMM | $0.225 | -23.7% | -43.8% |
IPD Group | IPG | $2.80 | -18.4% | -37.1% |
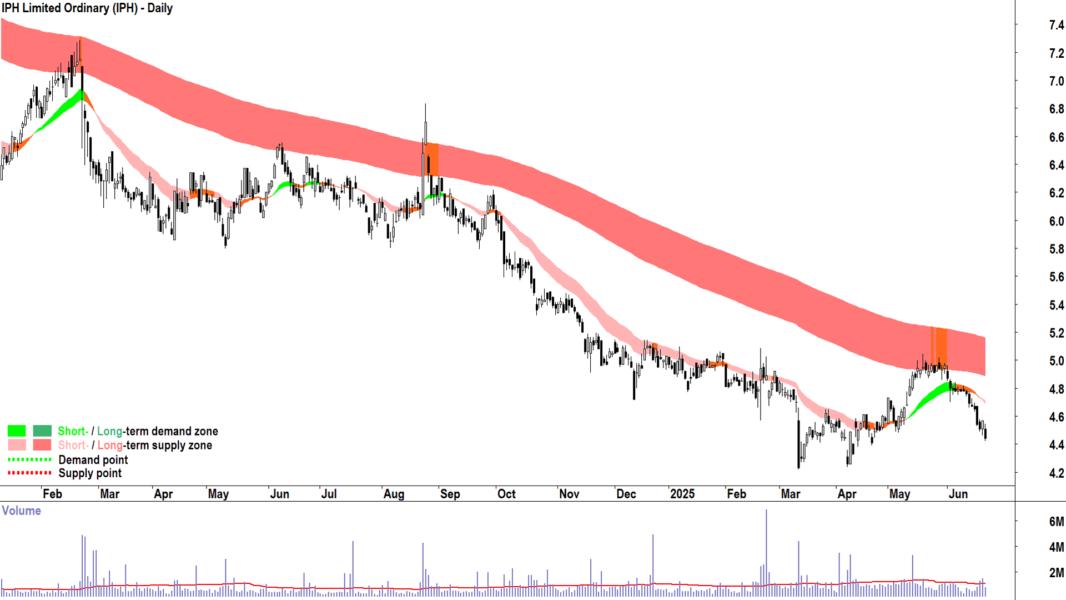
IPH | IPH | $4.44 | -9.8% | -28.4% |
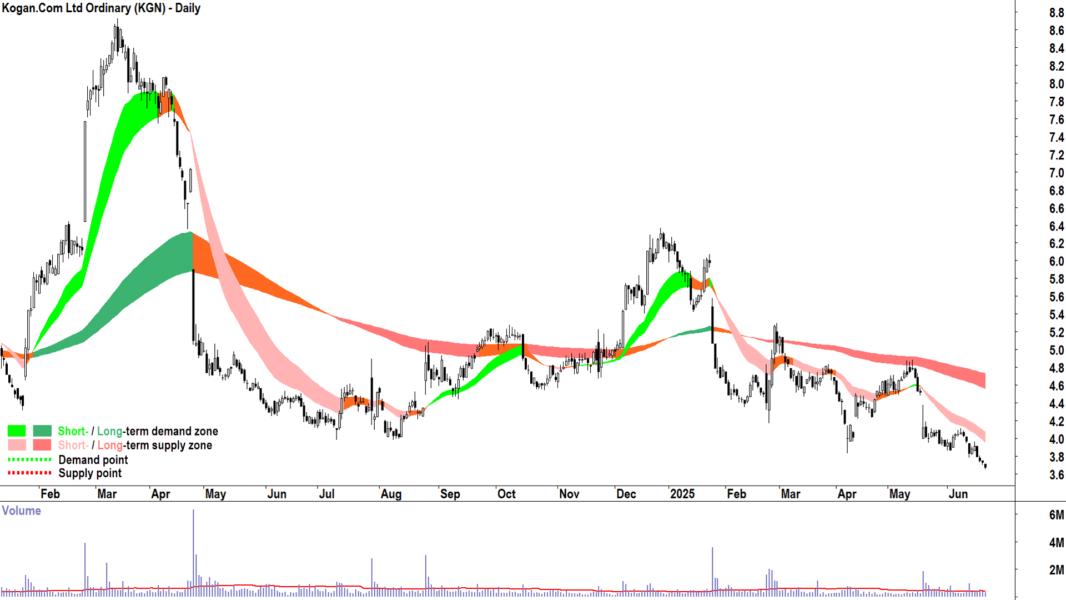
Kogan.Com | KGN | $3.67 | -8.3% | -17.9% |
Lendlease Group | LLC | $5.44 | -6.5% | +0.2% |
Larvotto Resources | LRV | $0.545 | -18.7% | +486.0% |
Magellan Financial Group | MFG | $8.09 | -2.8% | -1.6% |
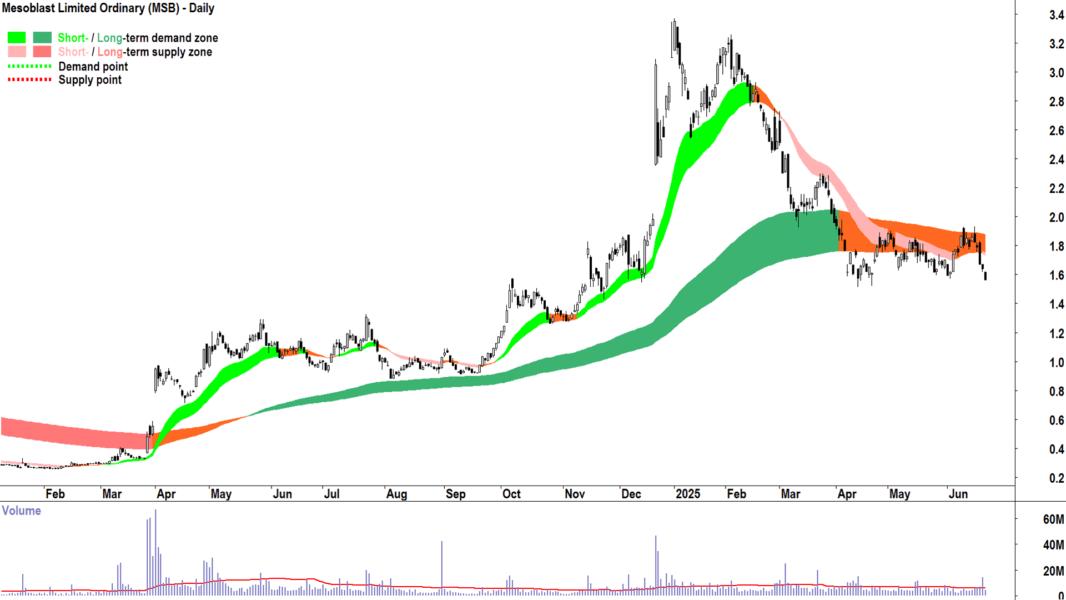
Mesoblast | MSB | $1.565 | -7.4% | +43.6% |
Novonix | NVX | $0.375 | -14.8% | -44.4% |
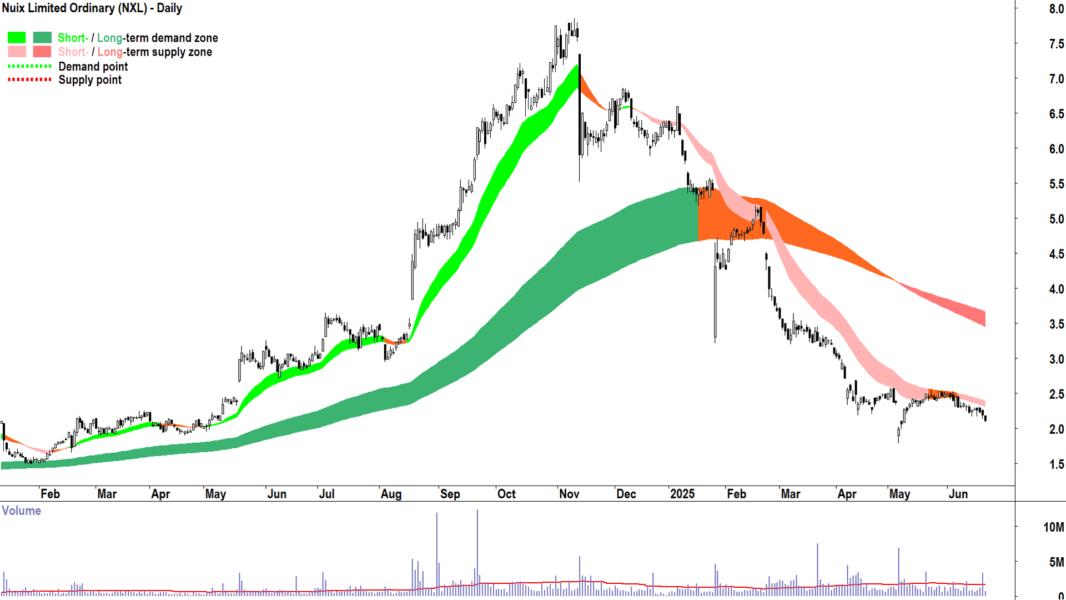
Nuix | NXL | $2.11 | -13.5% | -28.7% |
OFX Group | OFX | $0.740 | +2.1% | -65.6% |
Patriot Battery Metals | PMT | $0.220 | -4.3% | -66.4% |
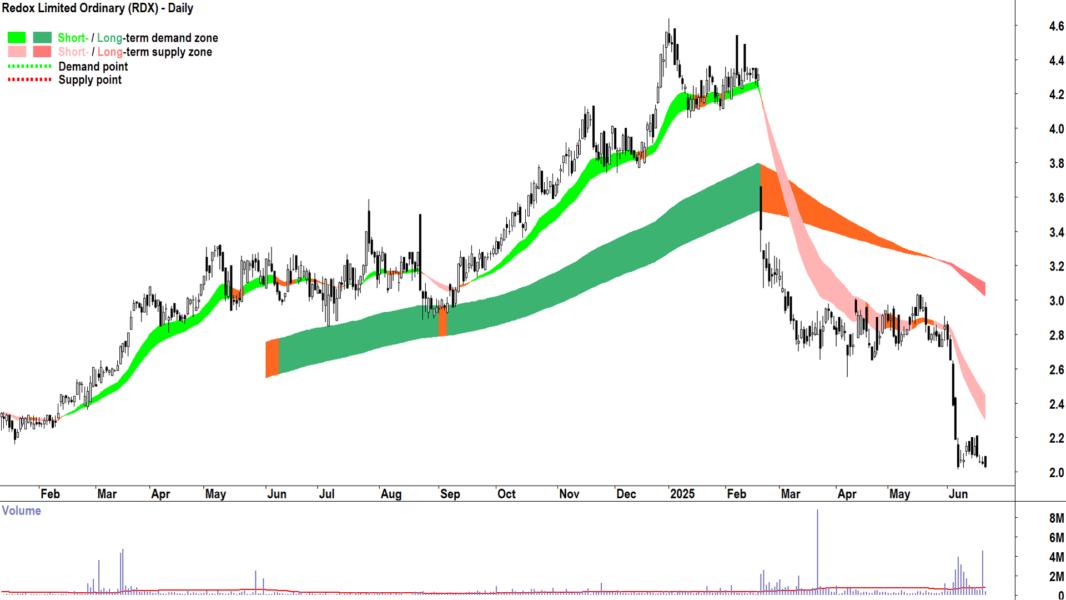
Redox | RDX | $2.03 | -26.7% | -36.2% |
Regal Partners | RPL | $2.02 | -6.5% | -42.3% |
Reliance Worldwide Corporation | RWC | $4.16 | -6.1% | -8.8% |
South32 | S32 | $2.85 | -7.8% | -22.1% |
Syrah Resources | SYR | $0.250 | -23.1% | -35.1% |
Treasury Wine Estates | TWE | $8.07 | -4.8% | -35.0% |
Today's Downtrends Scan List
Feature Charts from today's Downtrends List 🔎📉
The stocks that I feel are showing the strongest excess supply from today's Downtrends List are: Acrow ![]() ACF, AGL Energy
ACF, AGL Energy ![]() AGL, Austin Engineering
AGL, Austin Engineering ![]() ANG, Bellevue Gold
ANG, Bellevue Gold ![]() BGL, Clinuvel Pharmaceuticals
BGL, Clinuvel Pharmaceuticals ![]() CUV, Guzman y Gomez
CUV, Guzman y Gomez ![]() GYG, Healthco Healthcare and Wellness Reit
GYG, Healthco Healthcare and Wellness Reit ![]() HCW, IDP Education
HCW, IDP Education ![]() IEL, Iluka Resources
IEL, Iluka Resources ![]() ILU, Immutep
ILU, Immutep ![]() IMM, IPH
IMM, IPH ![]() IPH, Kogan.Com
IPH, Kogan.Com ![]() KGN, Larvotto Resources
KGN, Larvotto Resources ![]() LRV, Mesoblast
LRV, Mesoblast ![]() MSB, Novonix
MSB, Novonix ![]() NVX, Nuix
NVX, Nuix ![]() NXL, Redox
NXL, Redox ![]() RDX, Reliance Worldwide Corporation
RDX, Reliance Worldwide Corporation ![]() RWC, South32
RWC, South32 ![]() S32, Syrah Resources
S32, Syrah Resources ![]() SYR.
SYR.
10 Randomly chosen Feature Downtrend Charts below:

Important considerations when using the ChartWatch Daily ASX Scans:
1. The future is unknown. Anything can happen to change the trends in the lists above. A stock in a perfect uptrend or downtrend may not remain that way by the close of trading today. 2. These lists are not exhaustive, they are curated by Carl. You will find that certain stocks might not appear in a particular list on consecutive days but might reappear when Carl feels it deserves to return to the list. 3. This is not a recommendation service, merely an aid to help you better understand the workings of Carl’s technical analysis model in a practical way. Carl will not alert you to stocks that have dropped off a list because their trend has changed – it is up to you to apply the criteria to determine why a particular stock might not still be included. 4. This is general, educational information only – always do your own research.