ChartWatch ASX Scans: Data#3, Evolution Mining, Healius, Lynas Rare Earths, Newmont, Solvar, Kelsian, Tabcorp
- Interesting uptrends in today's Scans: Alto Metals , Bravura , Car , Data#3 , Evolution Mining , Healius , Hub24 , Humm , Lynas Rare Earths , Newmont
- Interesting downtrends in today's Scans: Kelsian Group , Omni Bridgeway , OOH!Media , Tabcorp , The Lottery Corporation
Welcome to my ChartWatch Daily ASX Scans series. Here I present scan lists based on my trend following technical analysis methodology. My goal is to alert you to the best uptrends and downtrends on the ASX.
Uptrends Scan List
Company | Code | Last Price | 1mo % | 1yr % |
|---|---|---|---|---|
Australian Clinical Labs | ACL | $2.73 | +5.4% | -14.2% |
Australian Gold and Copper | AGC | $0.360 | +24.1% | +520.7% |
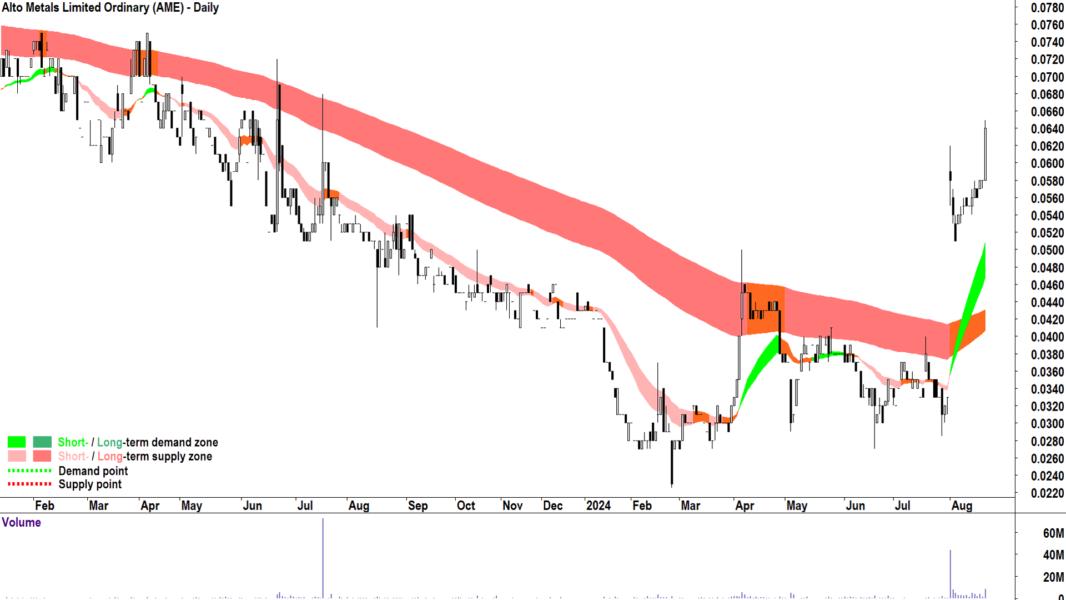
Alto Metals | AME | $0.064 | +82.9% | +18.5% |
Aspen Group | APZ | $2.18 | +17.8% | +24.6% |
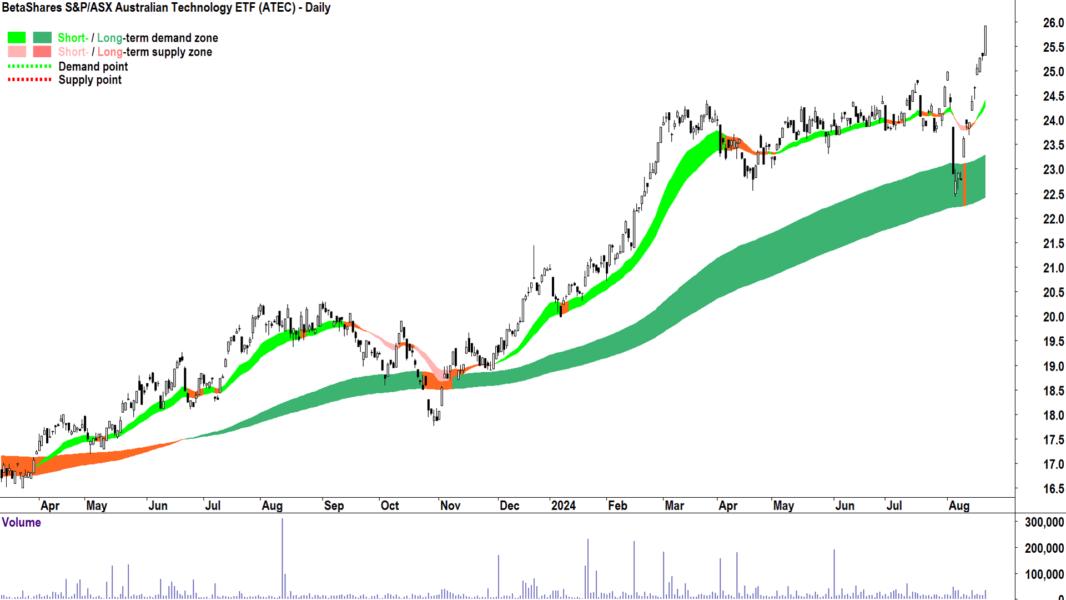
BetaShares S&P/ASX Australian Technology ETF | ATEC | $25.92 | +7.3% | +32.0% |
Australian United Investment Company | AUI | $10.92 | +5.5% | +10.3% |
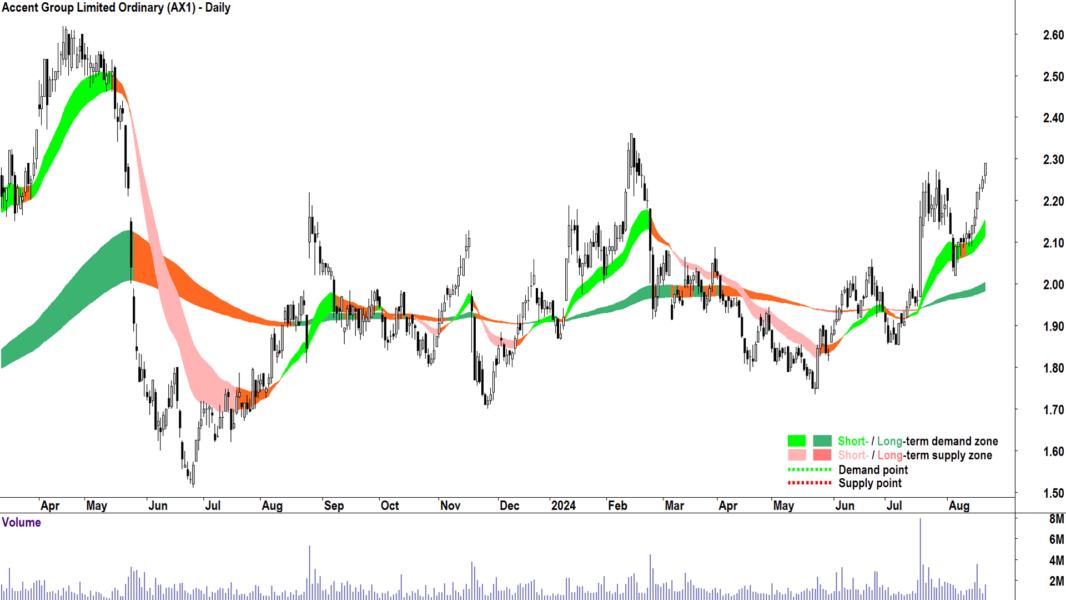
Accent Group | AX1 | $2.29 | +5.5% | +19.3% |
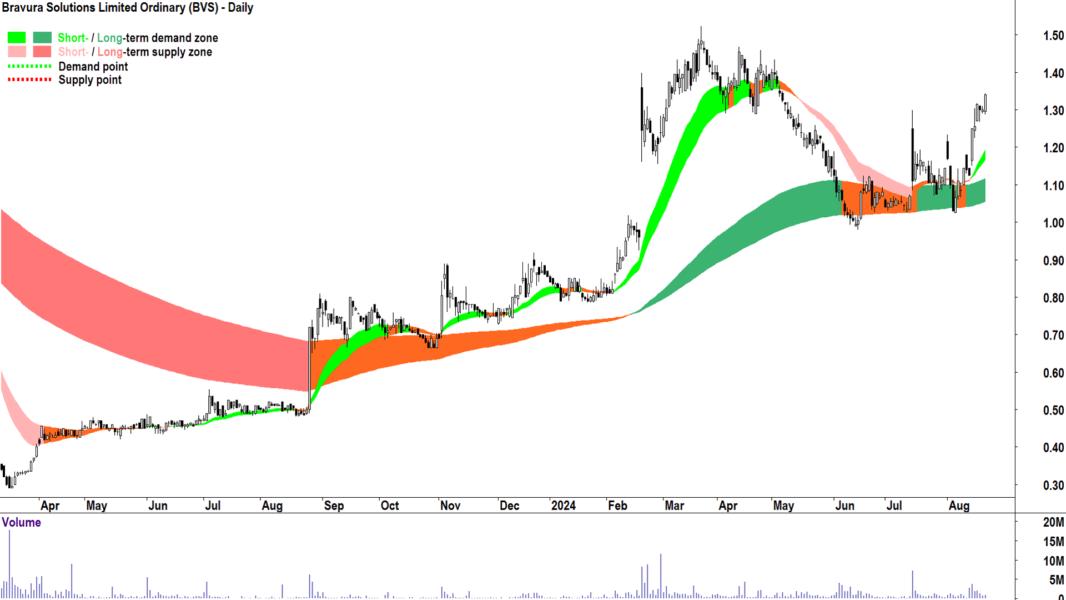
Bravura Solutions | BVS | $1.340 | +21.3% | +176.3% |
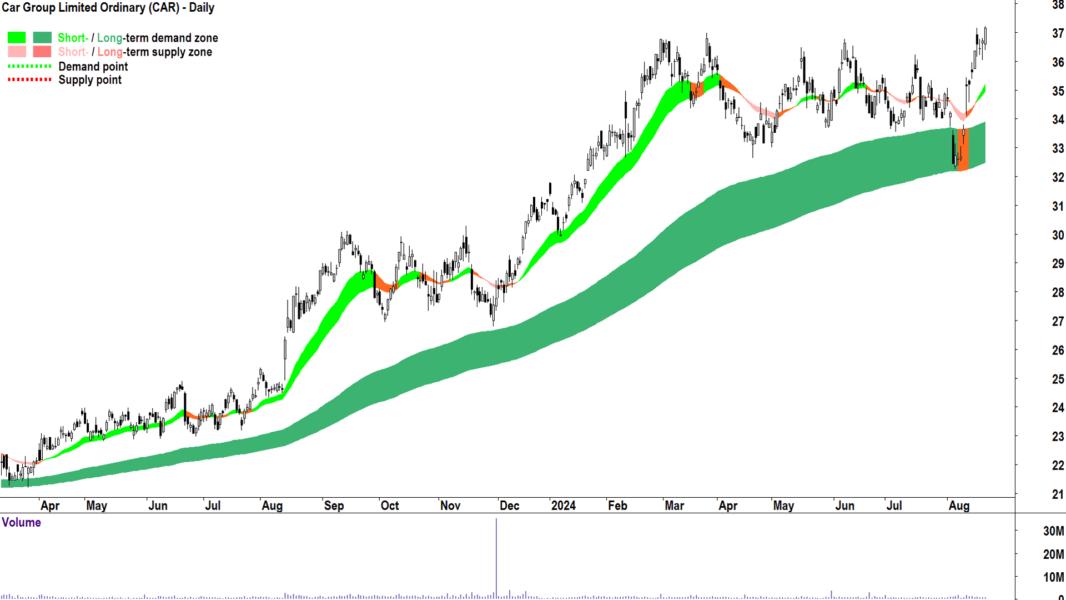
Car Group | CAR | $37.16 | +5.7% | +33.2% |
Catapult Group International | CAT | $2.17 | +6.9% | +110.7% |
Capricorn Metals | CMM | $6.01 | +13.4% | +49.9% |
Coles Group | COL | $18.44 | +3.4% | +6.6% |
BetaShares Australian Investment Grade Corporate Bond ETF | CRED | $23.33 | +2.7% | +6.5% |
Clarity Pharmaceuticals | CU6 | $6.33 | -0.6% | +551.3% |
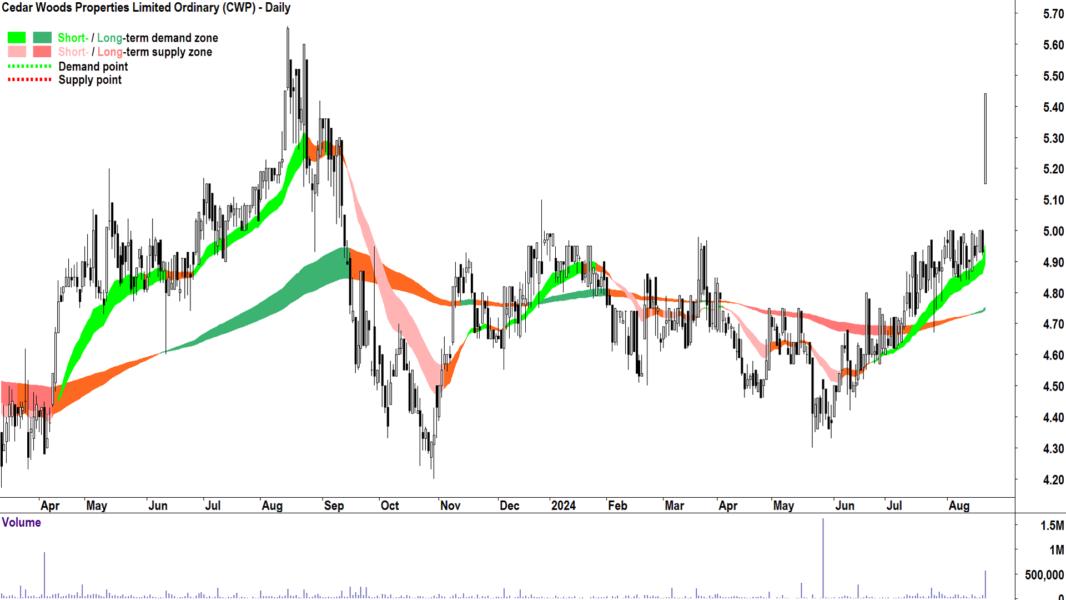
Cedar Woods Properties | CWP | $5.44 | +9.9% | -1.1% |
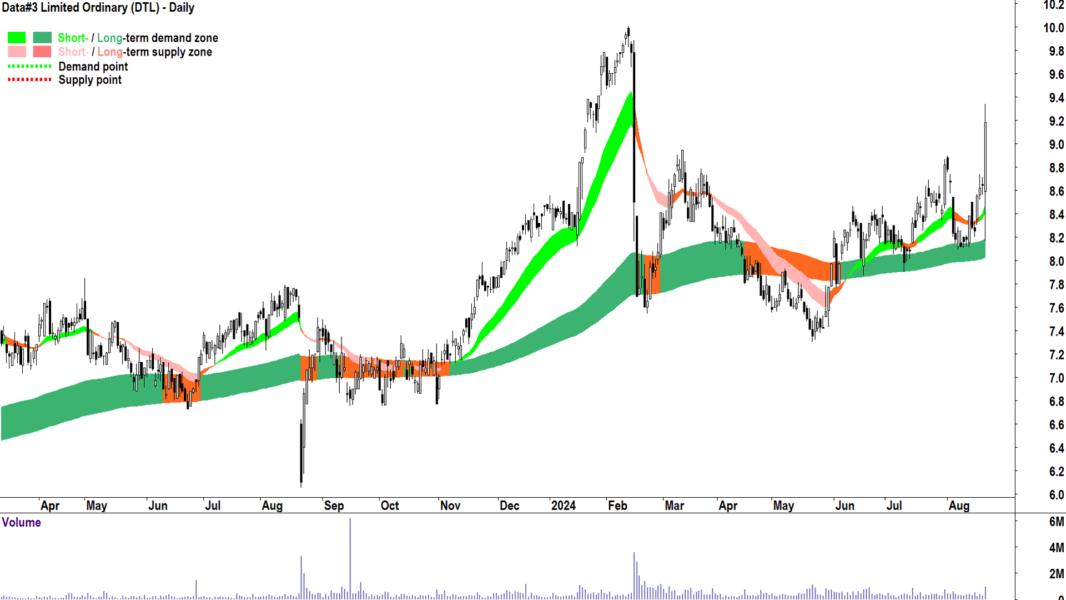
Data#3 | DTL | $9.18 | +7.4% | +19.4% |
Diversified United Investment | DUI | $5.28 | +1.9% | +6.5% |
Emeco | EHL | $0.860 | +1.2% | +30.3% |
Emerald Resources | EMR | $4.14 | +8.4% | +76.2% |
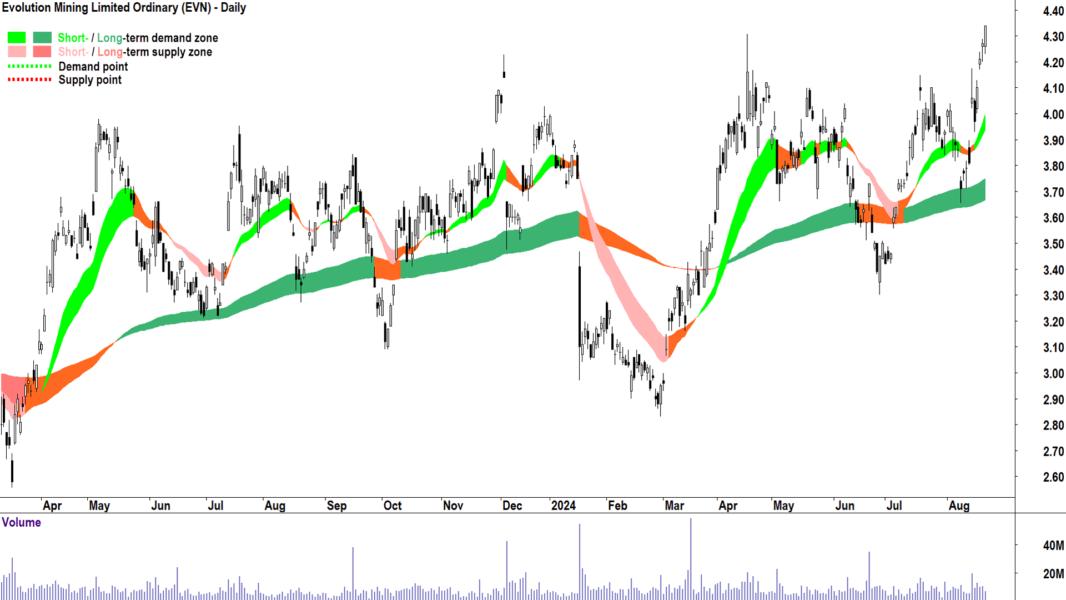
Evolution Mining | EVN | $4.34 | +10.2% | +29.2% |
BetaShares Australian Sustainability Leaders ETF | FAIR | $20.25 | +3.0% | +11.0% |
G8 Education | GEM | $1.405 | +8.9% | +23.2% |
Gold Road Resources | GOR | $1.845 | +4.8% | +21.8% |
Guzman y Gomez | GYG | $32.78 | +19.6% | 0% |
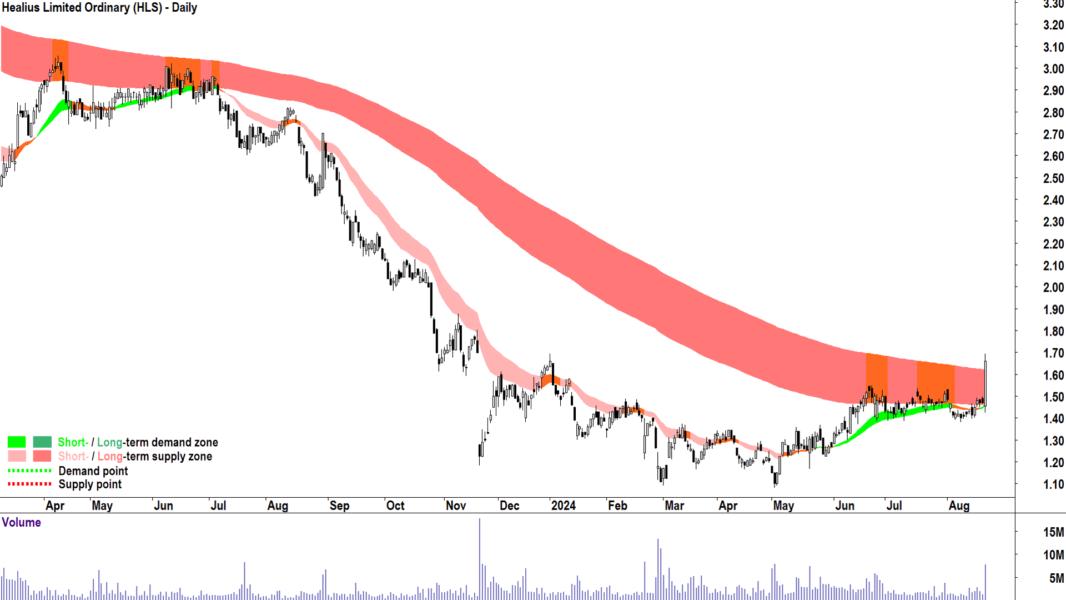
Healius | HLS | $1.660 | +12.9% | -39.8% |
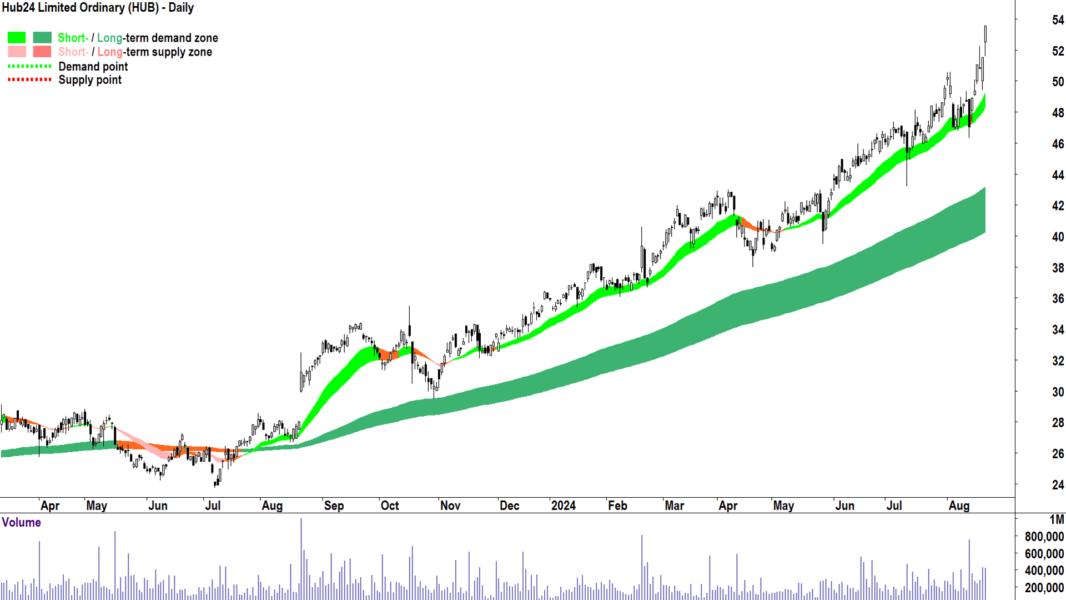
Hub24 | HUB | $53.55 | +13.7% | +93.3% |
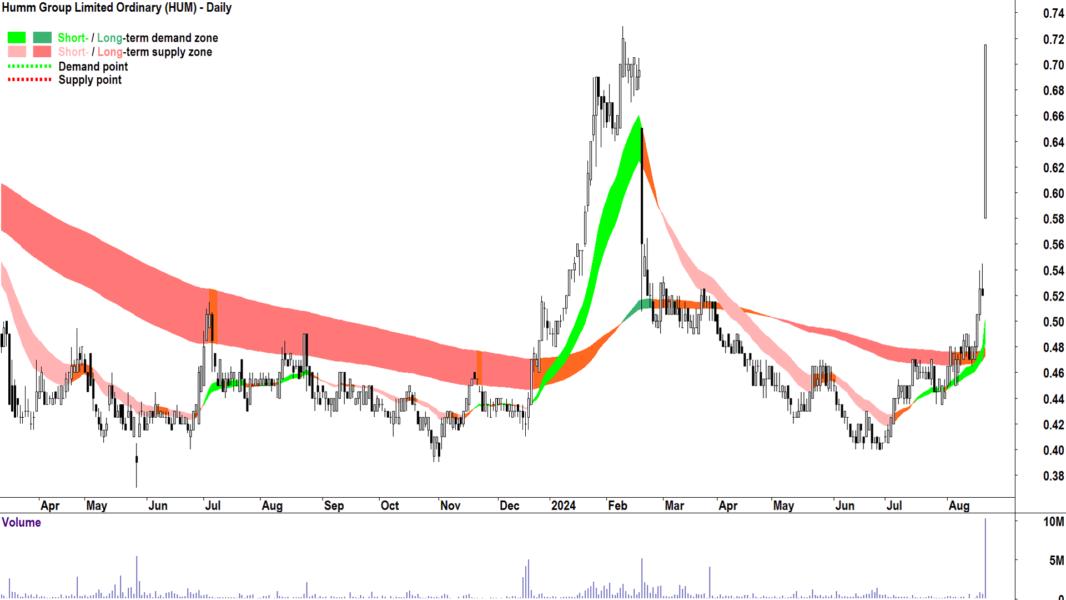
Humm Group | HUM | $0.715 | +57.1% | +53.8% |
Harvey Norman | HVN | $4.90 | +7.0% | +30.7% |
Insignia Financial | IFL | $2.93 | +9.7% | +2.8% |
Lovisa | LOV | $36.37 | +7.4% | +76.0% |
LTR Pharma | LTP | $1.325 | +47.2% | 0% |
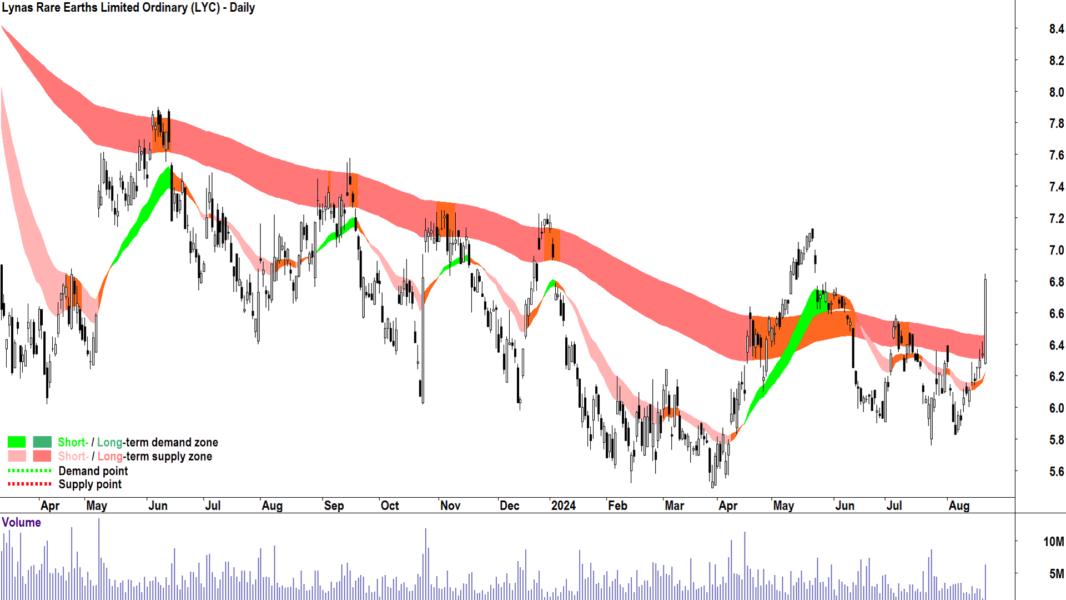
Lynas Rare Earths | LYC | $6.81 | +13.1% | -0.3% |
Macmahon | MAH | $0.315 | +14.5% | +96.9% |
MFF Capital Investments | MFF | $3.85 | -0.5% | +32.8% |
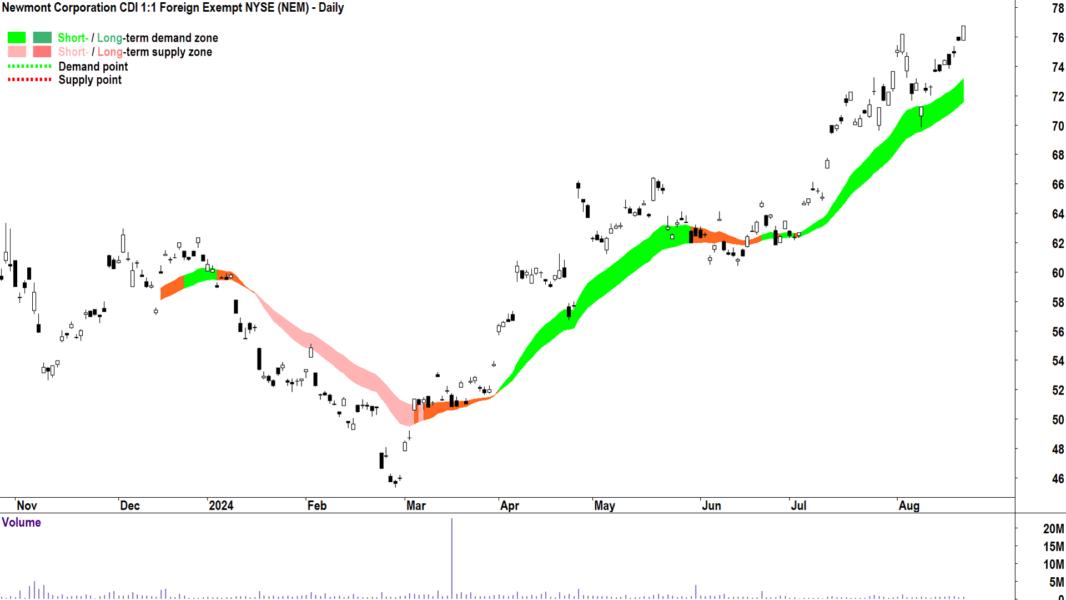
Newmont Corporation | NEM | $76.77 | +8.4% | 0% |
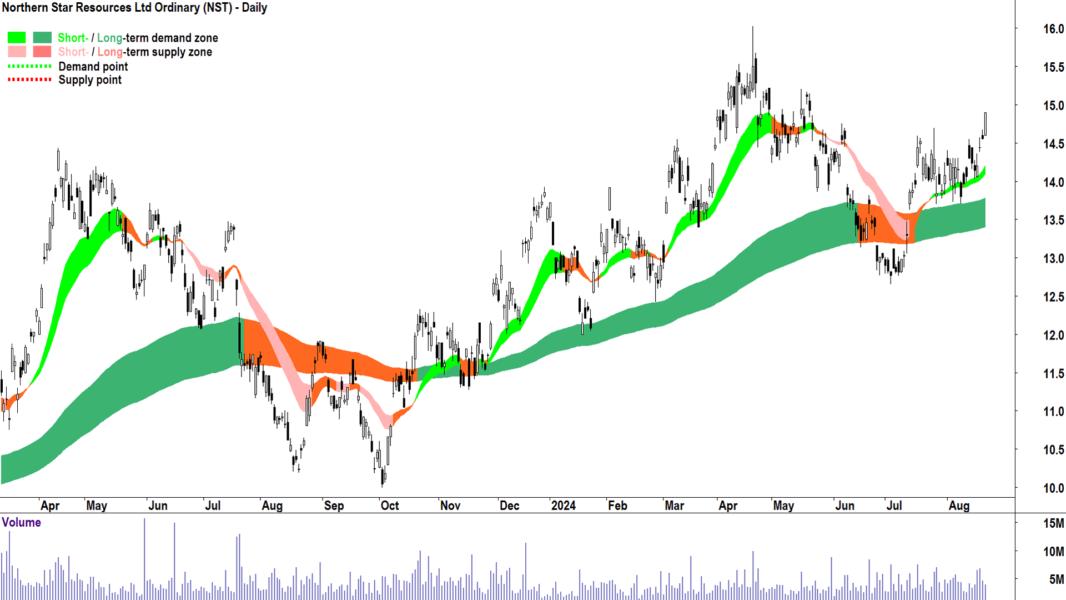
Northern Star Resources | NST | $14.90 | +6.3% | +43.8% |
NRW | NWH | $3.55 | +7.3% | +29.6% |
Netwealth Group | NWL | $23.18 | +2.4% | +51.2% |
Nextdc | NXT | $17.67 | +3.9% | +37.0% |
Predictive Discovery | PDI | $0.280 | +43.6% | +53.4% |
Pro Medicus | PME | $149.89 | +11.7% | +113.8% |
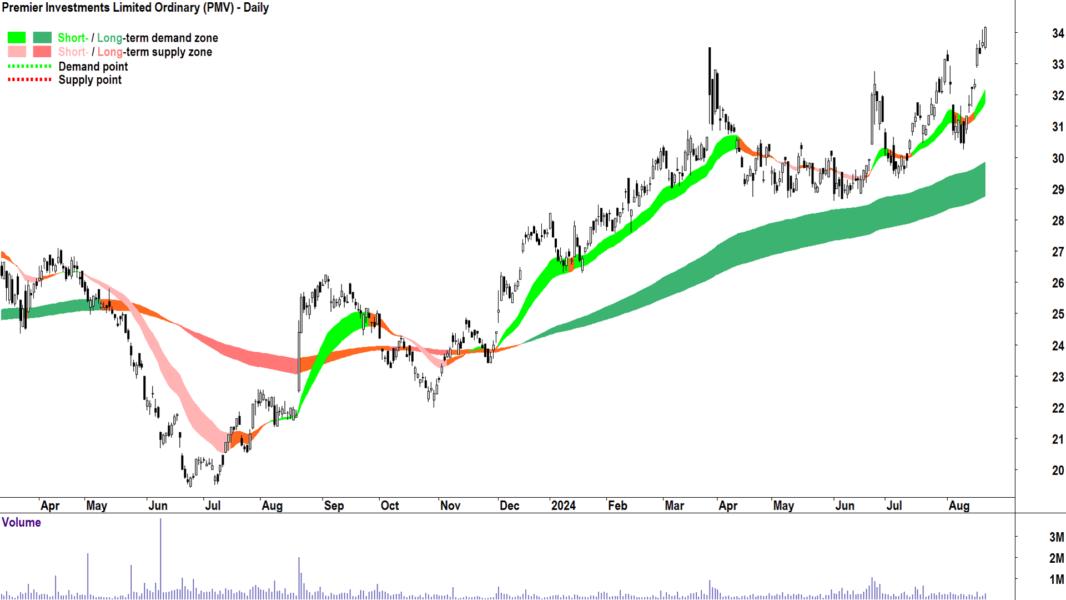
Premier Investments | PMV | $34.16 | +9.0% | +57.1% |
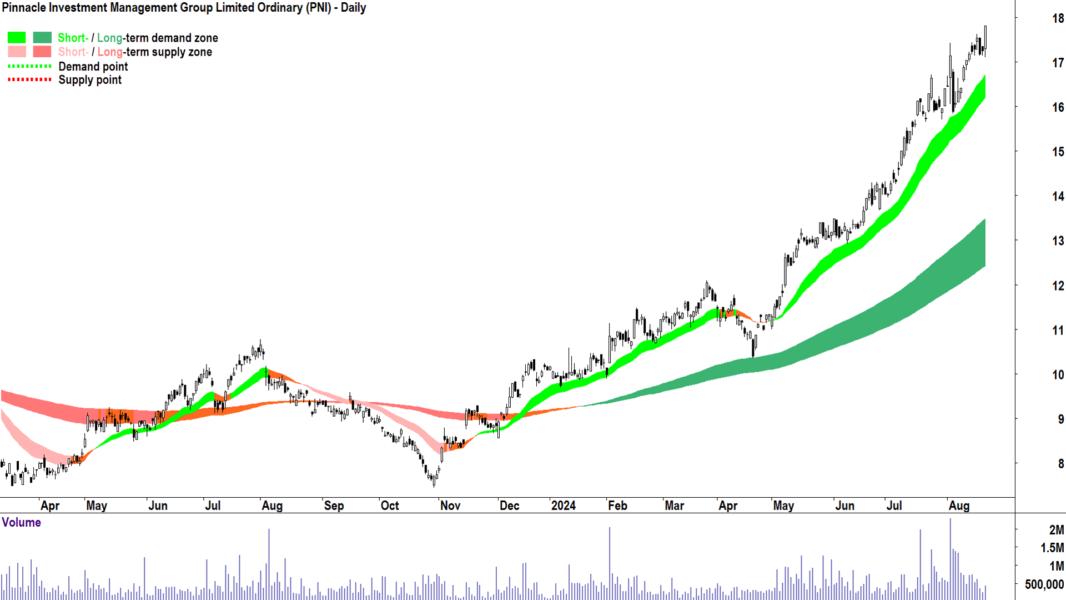
Pinnacle Investment Management Group | PNI | $17.82 | +9.4% | +89.4% |
Polynovo | PNV | $2.61 | +0.4% | +72.3% |
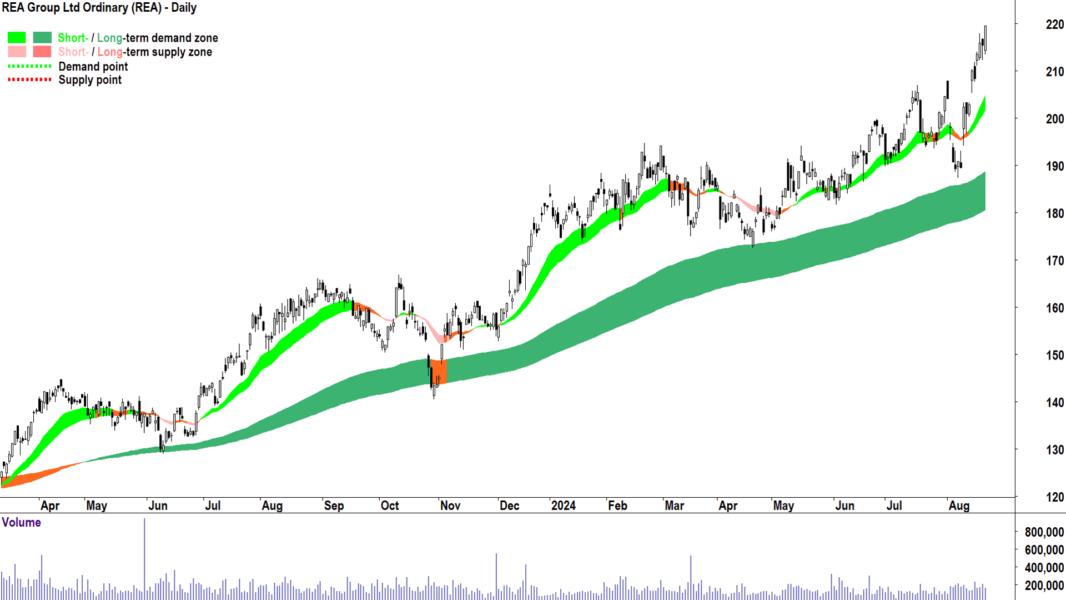
REA Group | REA | $219.56 | +11.8% | +37.8% |
Resolute Mining | RSG | $0.690 | +10.4% | +115.6% |
St Barbara | SBM | $0.255 | +13.3% | +21.4% |
Steadfast Group | SDF | $6.47 | +2.4% | +12.9% |
Spartan Resources | SPR | $1.380 | +12.2% | +444.7% |
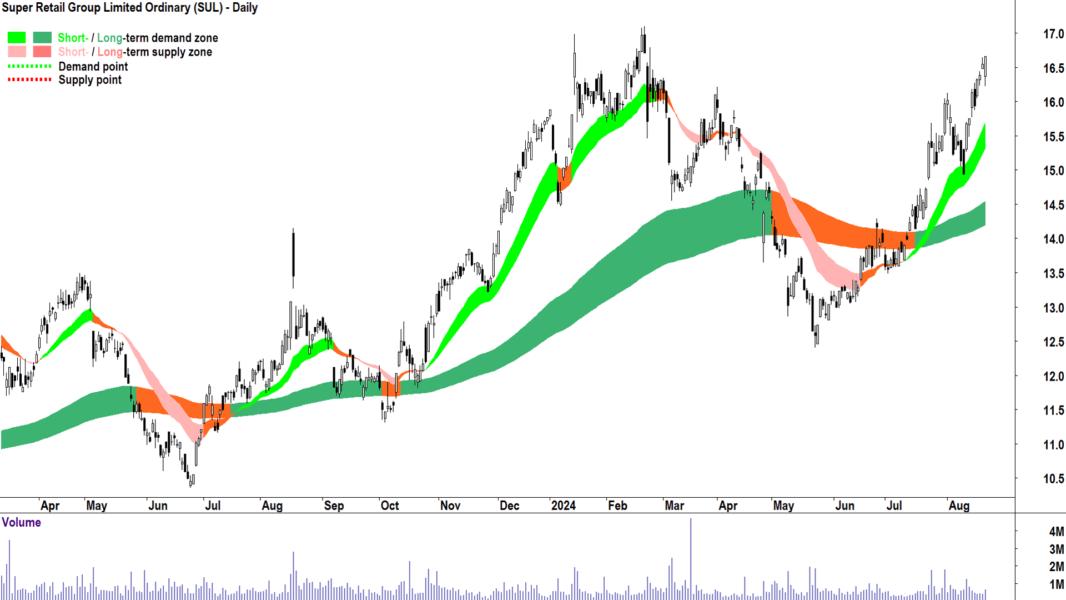
Super Retail Group | SUL | $16.66 | +8.3% | +33.0% |
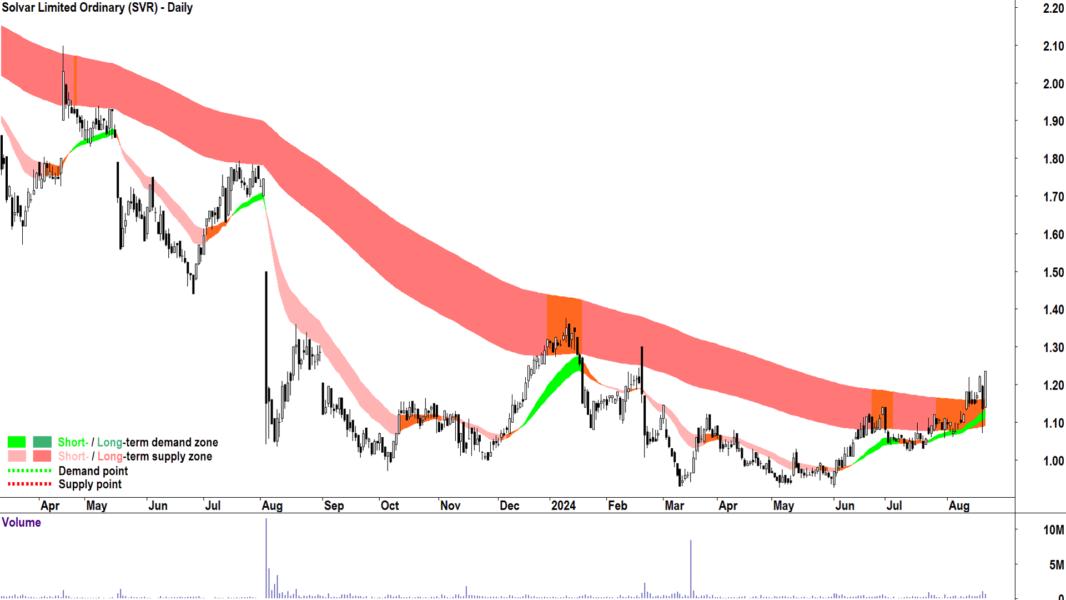
Solvar | SVR | $1.235 | +15.4% | -5.4% |
Transurban Group | TCL | $13.49 | +4.3% | +2.4% |
Telix Pharmaceuticals | TLX | $19.97 | -1.7% | +104.0% |
Technology One | TNE | $22.76 | +20.0% | +57.1% |
WA1 Resources | WA1 | $15.73 | +4.9% | +199.0% |
Wesfarmers | WES | $74.81 | +3.6% | +51.4% |
Westgold Resources | WGX | $3.05 | +16.9% | +114.8% |
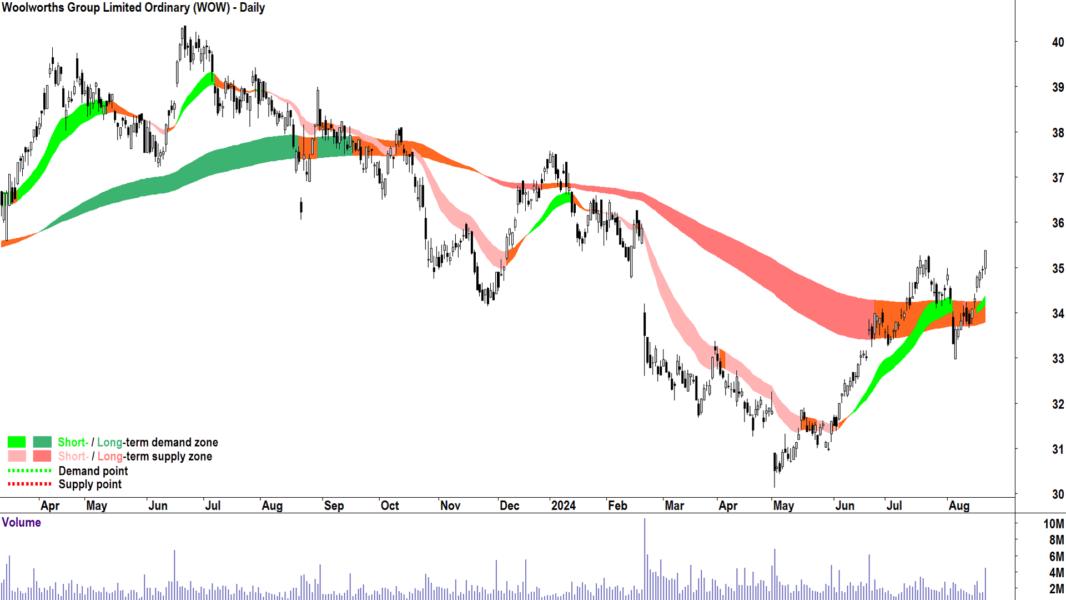
Woolworths Group | WOW | $35.37 | +1.3% | -5.9% |
Waypoint Reit | WPR | $2.60 | +6.6% | +3.6% |
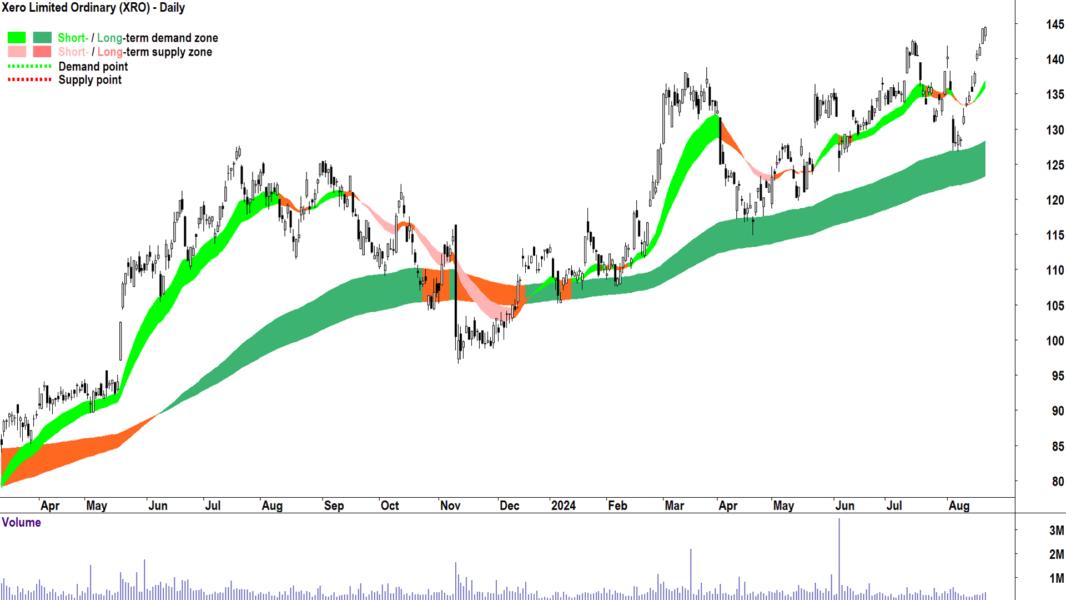
Xero | XRO | $144.41 | +6.3% | +26.4% |
Zip Co. | ZIP | $2.19 | +21.7% | +476.3% |
Today's Uptrends Scan List
Feature charts from today's Uptrends List 🔎📈
The stocks that I feel are showing the strongest excess demand from today's Uptrends List are: Alto Metals AAME, BetaShares S&P/ASX Australian Technology ETF ![]() ATEC, Accent Group
ATEC, Accent Group ![]() AX1, Bravura Solutions
AX1, Bravura Solutions ![]() BVS, Car Group
BVS, Car Group ![]() CAR, Cedar Woods Properties
CAR, Cedar Woods Properties ![]() CWP, Data#3
CWP, Data#3 ![]() DTL, Evolution Mining
DTL, Evolution Mining ![]() EVN, Healius
EVN, Healius ![]() HLS, Hub24
HLS, Hub24 ![]() HUB, Humm Group
HUB, Humm Group ![]() HUM, Lynas Rare Earths
HUM, Lynas Rare Earths ![]() LYC, Newmont Corporation
LYC, Newmont Corporation ![]() NEM, Northern Star Resources
NEM, Northern Star Resources ![]() NST, Premier Investments
NST, Premier Investments ![]() PMV, Pinnacle Investment Management Group
PMV, Pinnacle Investment Management Group ![]() PNI, REA Group
PNI, REA Group ![]() REA, Super Retail Group
REA, Super Retail Group ![]() SUL, Solvar
SUL, Solvar ![]() SVR, Woolworths Group
SVR, Woolworths Group ![]() WOW, Xero
WOW, Xero ![]() XRO.
XRO.
Charts of each below:
Downtrends Scan List
Company | Code | Last Price | 1mo % | 1yr % |
|---|---|---|---|---|
Auckland International Airport | AIA | $6.86 | -2.3% | -10.0% |
Beach Energy | BPT | $1.285 | -14.9% | -15.7% |
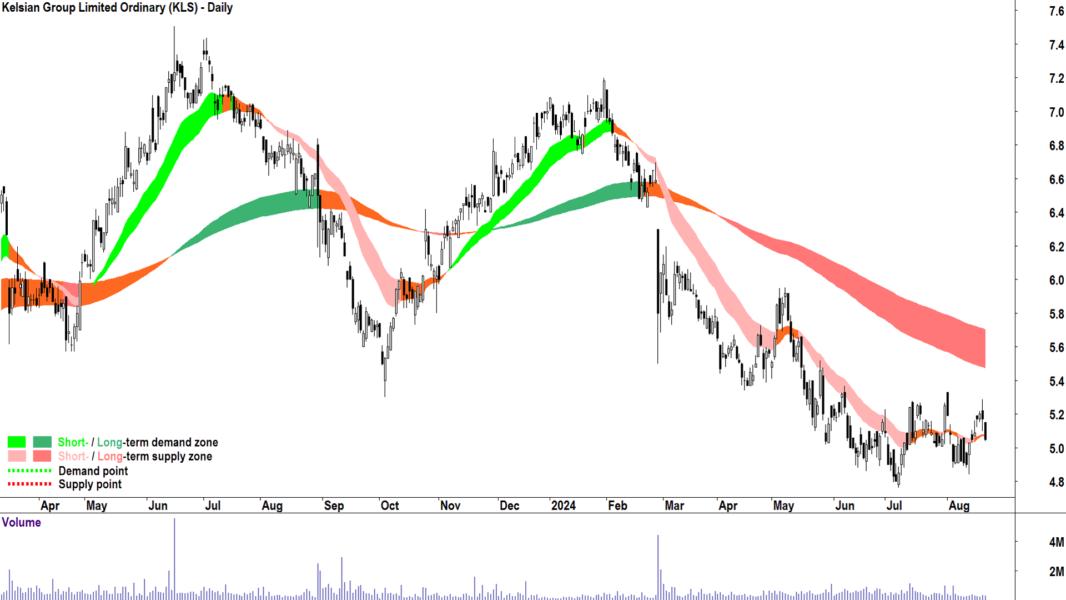
Kelsian Group | KLS | $5.05 | -1.6% | -24.9% |
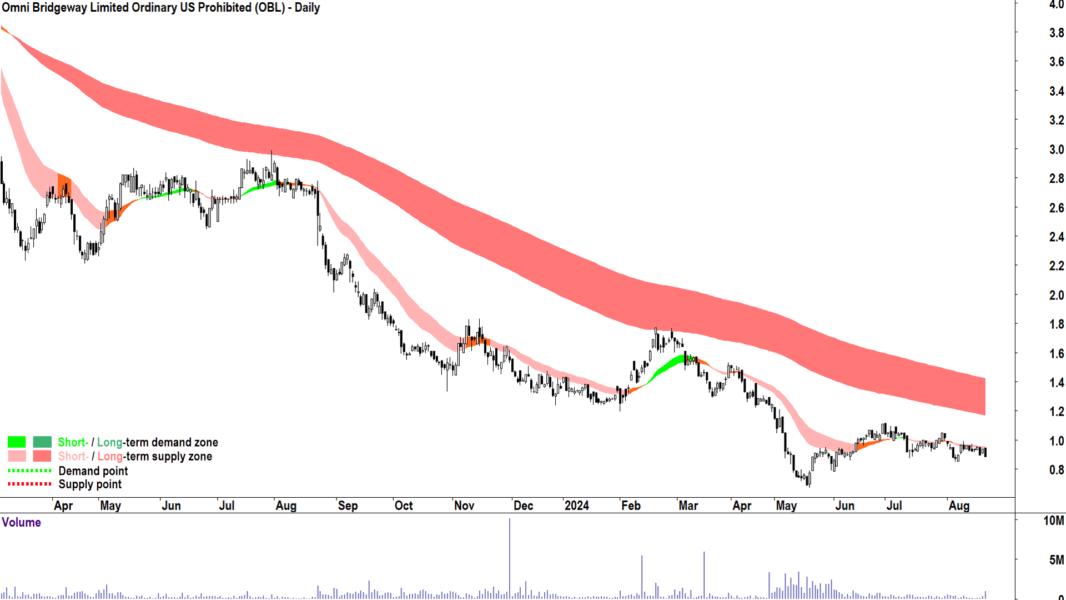
Omni Bridgeway | OBL | $0.885 | -9.2% | -68.3% |
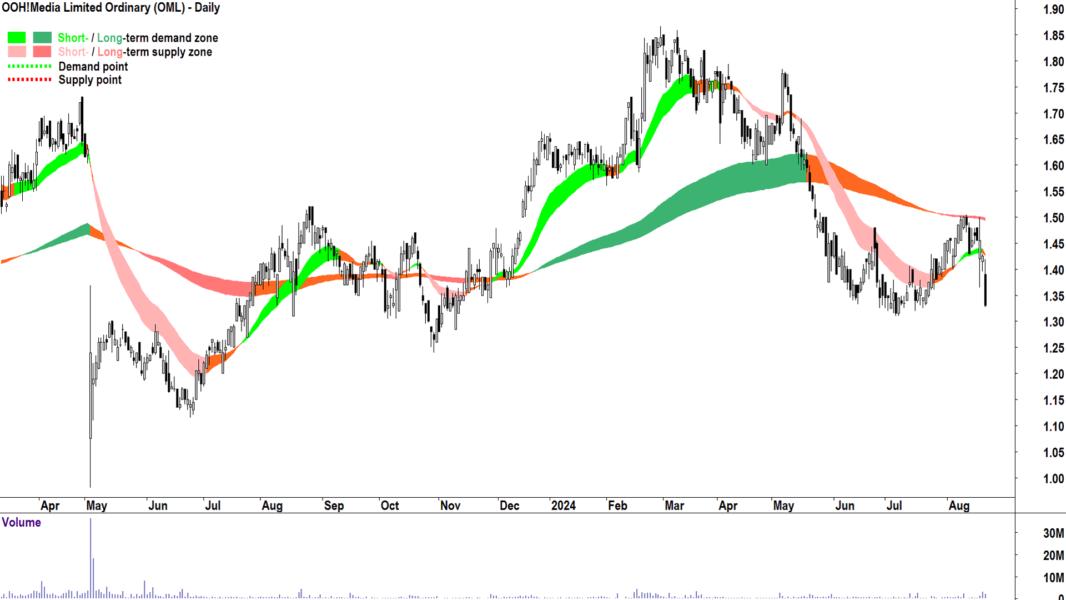
OOH!Media | OML | $1.330 | -3.3% | -2.9% |
Power | PWH | $9.41 | -21.5% | -3.7% |
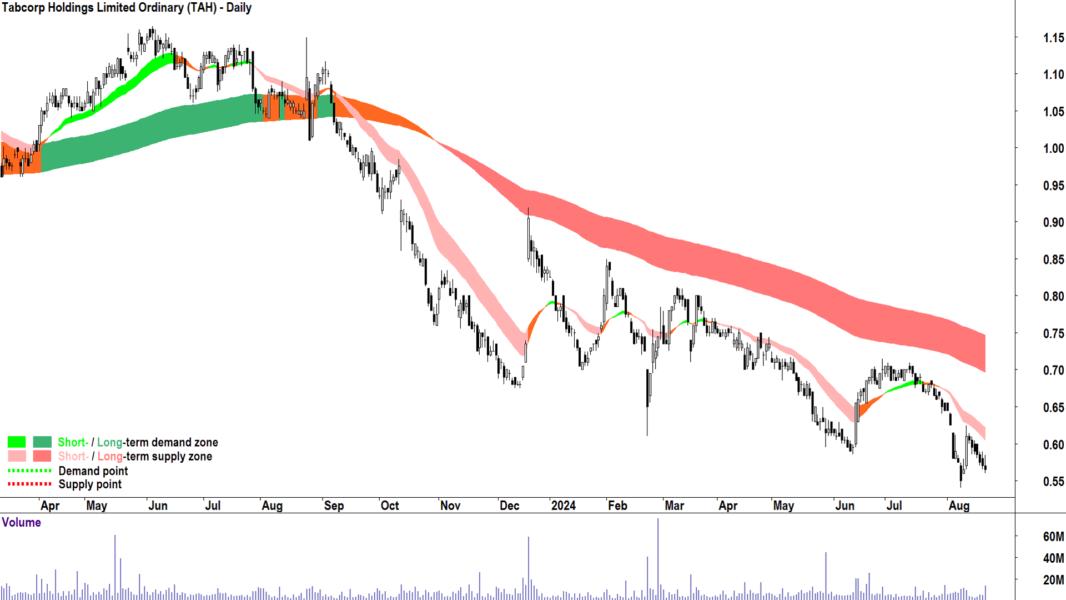
Tabcorp | TAH | $0.565 | -16.9% | -46.2% |
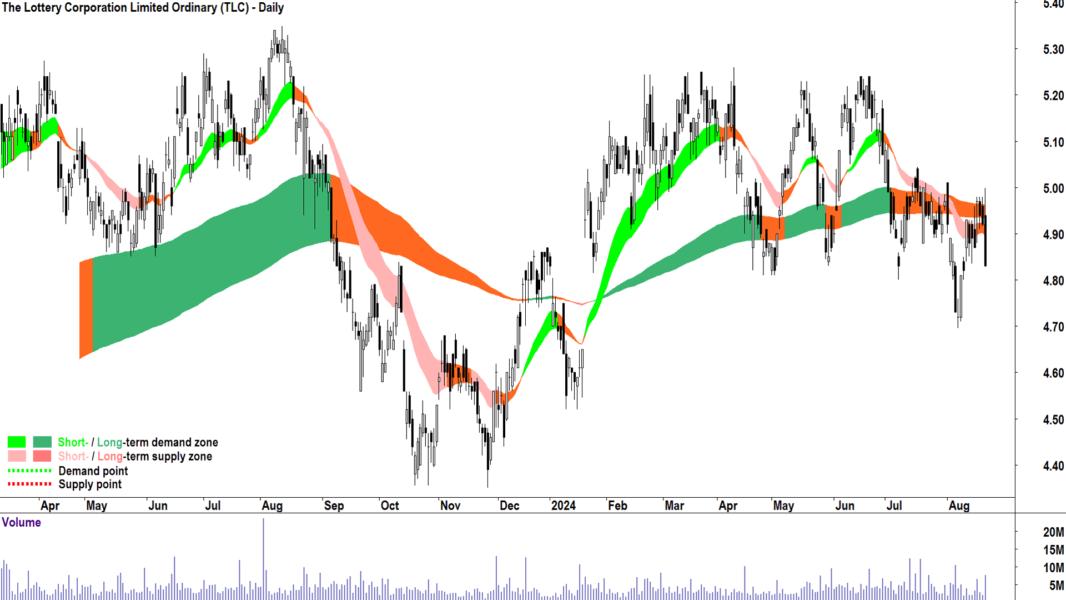
The Lottery Corporation | TLC | $4.83 | -2.2% | -6.0% |
Today's Downtrends Scan List
Feature charts from today's Downtrends List 🔎📉
The stocks that I feel are showing the strongest excess supply from today's Downtrends List are: Kelsian Group ![]() KLS, Omni Bridgeway
KLS, Omni Bridgeway ![]() OBL, OOH!Media
OBL, OOH!Media ![]() OML, Tabcorp
OML, Tabcorp ![]() TAH, The Lottery Corporation
TAH, The Lottery Corporation ![]() TLC.
TLC.
Charts of each below:
ChartWatch ASX Scans Criteria
Criteria for Uptrends List
Short term uptrend (ST trend ribbon is light green)
Long term uptrend or long term trend is transitioning from down to up (LT trend ribbon is dark green, or LT trend ribbon is amber and contracting)
Demand-side price action (rising peaks and rising troughs is preferred, but based upon weight of evidence of other criteria rising peaks only or rising troughs only may be permitted)
Predominance of demand-side candles (i.e., white bodies and or downward pointing shadows)
The last candle in particular is a strong demand-side candle
Criteria for Downtrends List
Short term downtrend (ST trend ribbon is light pink)
Long term downtrend or long term trend is transitioning from up to down (LT trend ribbon is dark pink, or LT trend ribbon is amber and contracting)
Supply-side price action (falling peaks and falling troughs is preferred, but based upon weight of evidence of other criteria falling peaks only or falling troughs only may be permitted)
Predominance of supply-side candles (i.e., black bodies and or upward pointing shadows)
The last candle in particular is a strong supply-side candle
Important considerations when using the ChartWatch ASX Scan Lists:
1. The future is unknown. Anything can happen to change the trends in the lists above. A stock in a perfect uptrend or downtrend may not remain that way by the close of trading today. 2. These lists are not exhaustive, they are curated by Carl. You will find that certain stocks might not appear in a particular list on consecutive days but might reappear when Carl feels it deserves to return to the list. 3. This is not a recommendation service, merely an aid to help you better understand the workings of Carl’s technical analysis model in a practical way. Carl will not alert you to stocks that have dropped off a list because their trend has changed – it is up to you to apply the criteria to determine why a particular stock might not still be included. 4. This is general, educational information only – always do your own research.