Which ASX graphite stock offers the best value?
- Which stocks offer the best value for money when based on graphite resource and market cap?
- Africa-based explorers such as Syrah, Black Rock Mining and EcoGraf tend to have a 'cheaper' resource
- Explorers and producers based in Australia and Europe have outperformed their peers
At its simplest form, investing in mining is all about who has the biggest resource with the best grades and the ability to extract it at the lowest cost.
In this series, we’ll be looking at which graphite explorers, developers and producers offer the best value for money based on:
Market capitalisation
Latest Mineral Resource Estimate
Total Graphitic Carbon (TGC) grades
Which graphite stock offers the best value?
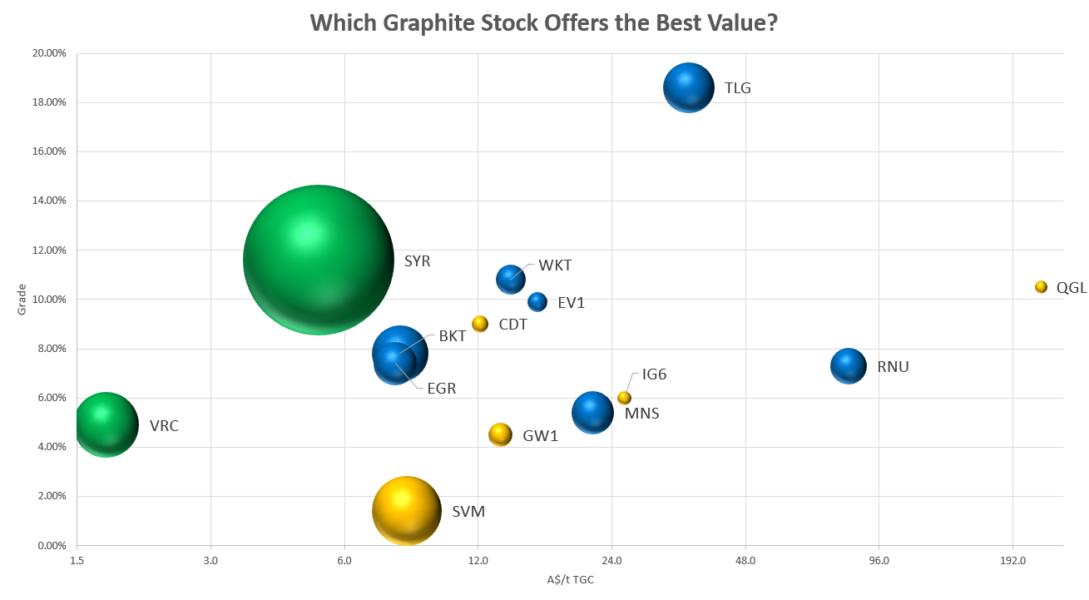
The table puts into perspective how much investors are paying for a tonne of graphite based on the company’s resource and market capitalisation.
X-Axis: How much you’re paying for a tonne of graphite based on the company’s graphite resource and market cap (aka market cap divided by resource)
Y-Axis: Total Graphitic Carbon (TGC) grades
Colour: Green (producer), Blue (developer or advanced explorer – progressing DFS) and Yellow (Explorer)
Bubble Size: Size of the resource – in terms of Contained Graphite
Put it simply: More left = cheaper the resource. More up = higher grades

The graph is for illustrative purposes only and should not be used as investment advice. If image is unclear, open image in new tab (Source: Market Index)
Readers should also note that:
What’s included in the data: The data uses the latest MRE and includes both Measured, Indicated and Inferred resources
What’s not included: The data does not take into consideration other factors that may influence the project economics and valuation such as geographical location, production costs, project status etc. This means that the data does not paint the full picture and should be used for illustrative purposes only
And this is the data in table format:
Ticker | Company | Mkt Cap ($m) | Location | TGC (%) | Contained Graphite (Kt) | A$/t TGC |
|---|---|---|---|---|---|---|
QGL | Quantum Graphite | 158 | Australia | 10.50% | 756 | 222.2 |
RNU | Renascor Resources | 533 | Australia | 7.30% | 6,826 | 81.8 |
TLG | Talga Energy | 500 | Sweden | 18.60% | 13,522 | 35.7 |
IG6 | International Graphite | 19 | Australia | 6.00% | 936 | 25.6 |
MNS | Magnis Resources | 225 | Tanzania | 5.40% | 9,396 | 21.7 |
EV1 | Evolution Energy | 36 | Tanzania | 9.90% | 1,990 | 16.3 |
WKT | Walkabout Resources | 64 | Tanzania | 10.80% | 4,514 | 14.2 |
GW1 | Greenwing Resources | 39 | Madagascar | 4.50% | 2,786 | 13.5 |
CDT | Castle Minerals | 17 | Ghana | 9.00% | 1,405 | 12.1 |
SVM | Sovereign Metals | 195 | Malawi | 1.40% | 25,326 | 8.3 |
BKT | Black Rock Mining | 123 | Tanzania | 7.80% | 16,622 | 8.0 |
EGR | EcoGraf | 72 | Tanzania | 7.40% | 9,487 | 7.8 |
SYR | Syrah Resources | 620 | Mozambique | 11.60% | 120,141 | 5.2 |
VRC | Volt Resources | 41 | Ukraine | 4.90% | 22,589 | 1.7 |
Market cap based on 19 May open (Source: Market Index)
Location matters
From our data set, there are three graphite players located in Australia and one from Europe (ex-Ukraine), with an average dollar per tonne of graphite of $91.30.
Then there’s nine names from Africa (Tanzania, Ghana, Malawi and Madagascar) and one from Ukraine, with an average dollar per tonne of graphite of $10.90.
This opens quite the can of worms. Is the premium worth it? Are the 'cheap' ones valued like that for a reason? Is there a better or preferred jurisdiction?
'Expensive' is outperforming
Most of the stocks towards the left of the table (or ‘cheaper’ section) are down around 15-30% year-to-date.
There appears to be a sweet spot (A$20-80) where names have held up relatively well amid volatile market conditions. All three are based in Australia or Europe.
Talga Resources (-1.8% year-to-date)
Renascor Resources (+2.3% year-to-date)
International Graphite (+3.7% year-to-date)
Producer status still comes with risks
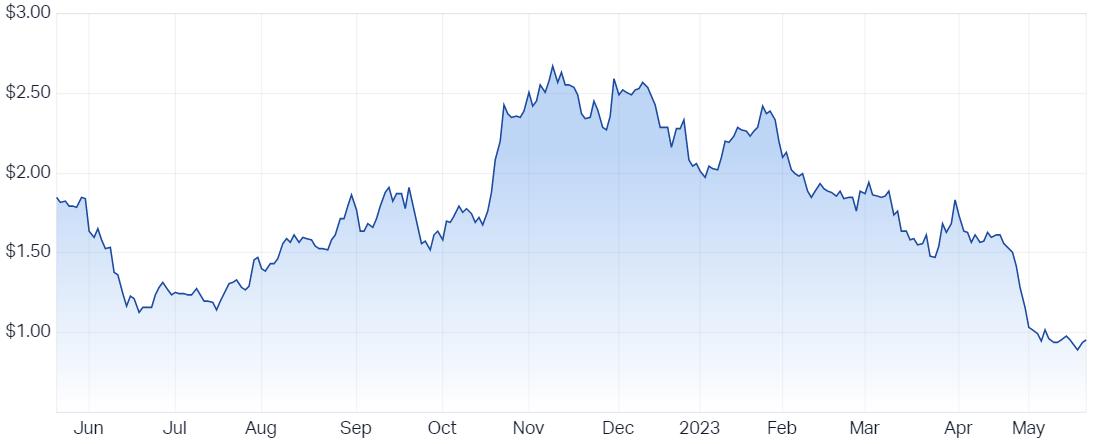
Syrah is an established graphite producer that operates the Balama Project in Mozambique. The stock is down 41.9% in the last month and 54.6% year-to-date. Most of its share price headwinds have been associated with higher-than-expected production costs, operational challenges and weak graphite prices. Some recent key catalysts for the stock include:
30 January: December quarter graphite production was 35,000 tonnes compared to 38,000 in the previous quarter. C1 cash costs were US$709 a tonne due to operational interruptions and sustained high diesel costs through the quarter. Syrah guided to US$430-480 per tonne C1 cash costs, assuming a normalisation of fuel prices. The stock fell around 13% in the four days following the announcement.
27 April:March quarter Balama production and shipments missed analyst expectations, unit costs of US$668 were well-above expectations. Syrah also flagged that it would moderate production until “demand conditions and sales orders at economic prices warrant higher capacity utilisation.” The stock fell 27% over the next three sessions.

Syrah Resources 12-month price chart (Source: Market Index)
Looking Ahead
We’ll be adding more stocks and updates to the data set as well as expanding the series to include other resources such as nickel, rare earths and copper.