Trade Spotlight: How should you trade Hindalco, InterGlobe Aviation, Kotak Mahindra Bank, PFC, Crompton Greaves Consumer, and others on March 6?
The benchmark indices decisively managed to snap a 10-day losing streak and closed with more than 1 percent gains on March 5, with further healthy trends in market breadth. A total of 2,321 shares saw buying interest, compared to 326 shares that declined on the NSE. The market needs to record a strong follow-up rally to confirm the change in trend. Until then, it seems to be in a consolidation phase. Below are some trading ideas for the near term:
Jatin Gedia, Technical Research Analyst at Mirae Asset Sharekhan
Crompton Greaves Consumer Electricals | CMP: Rs 344.6
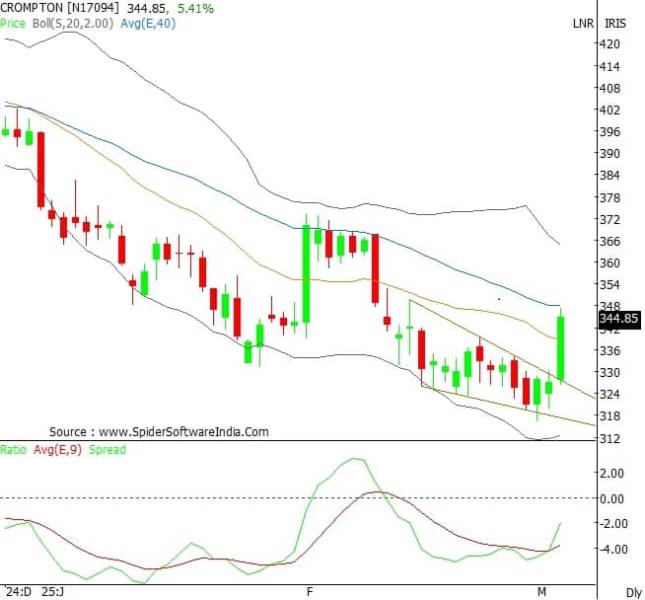
Crompton Greaves Consumer Electricals has broken out of an Ending Diagonal pattern on the daily charts. The daily momentum indicator has a positive crossover, which is a buy signal. We expect the stock to witness a sharp upmove towards Rs 361–373 from a short-term perspective.
Strategy: Buy
Target: Rs 361, Rs 373
Stop-Loss: Rs 336
NTPC | CMP: Rs 326.2
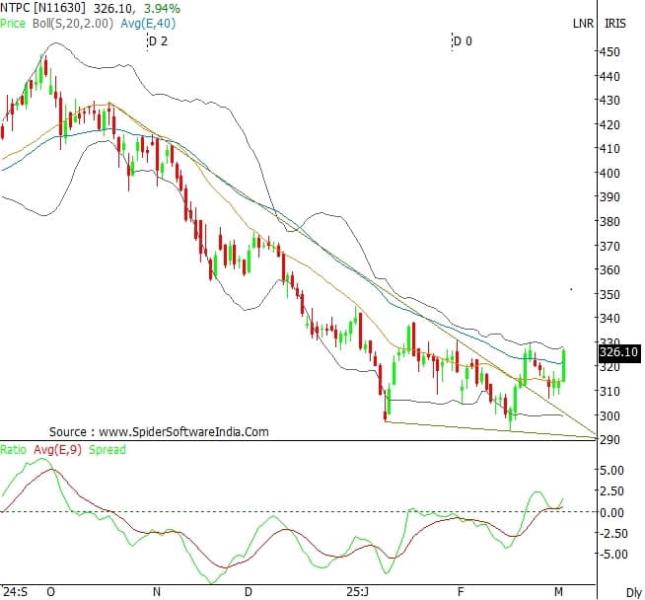
NTPC has witnessed the resumption of the upmove after taking support at the support cluster of the 20-day moving average and the 61.82% Fibonacci retracement level of the previous rise. The daily momentum indicator has triggered a positive crossover, which is a buy signal. We expect the stock to continue with the positive momentum towards Rs 353–371 from a short-term perspective.
Strategy: Buy
Target: Rs 353, Rs 371
Stop-Loss: Rs 318
Sudeep Shah, Deputy Vice President and Head of Technical and Derivative Research at SBI Securities
Hindalco Industries | CMP: Rs 657.35
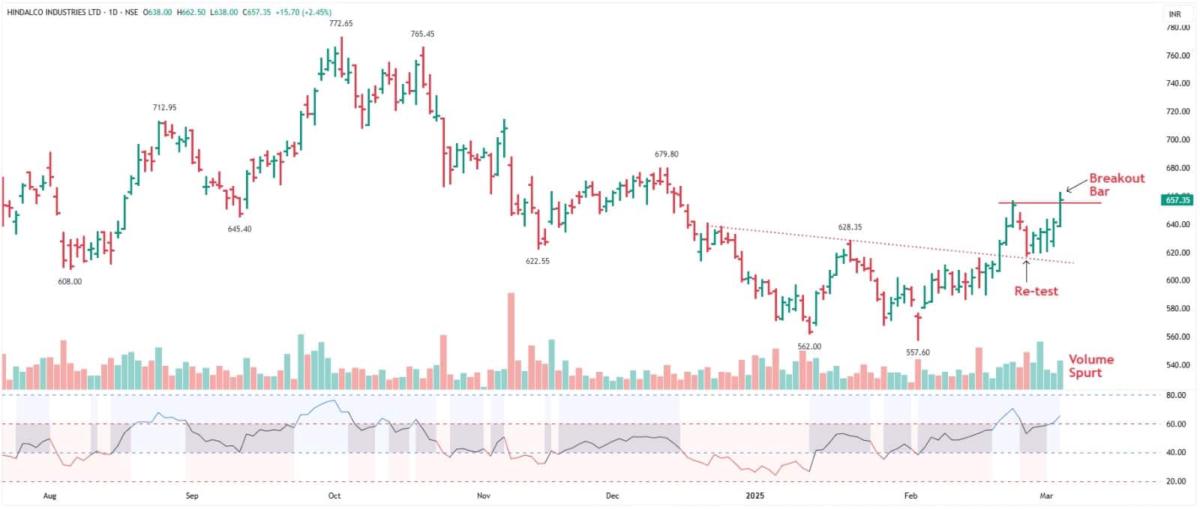
The Nifty Metal index has been strongly outperforming the frontline indices over the past few trading sessions. On Wednesday, it registered a consolidation breakout on the daily chart, signaling further bullish momentum. Notably, all constituents of the Metal index ended in positive territory, reflecting broad-based strength within the sector. The stock of Hindalco Industries has given a horizontal trendline breakout on a daily scale. This breakout is confirmed by a relatively higher volume.
In addition, it has formed a sizeable bullish candle on a daily scale, which adds strength to the breakout. Currently, the stock is trading above its short and long-term moving averages. The momentum indicators and oscillators are suggesting strong bullish momentum. Hence, we recommend accumulating the stock in the zone of Rs 660–655, with a stop-loss of Rs 635. On the upside, it is likely to test the level of Rs 710 in the short term.
Strategy: Buy
Target: Rs 710
Stop-Loss: Rs 635
Bharat Electronics | CMP: Rs 274.9
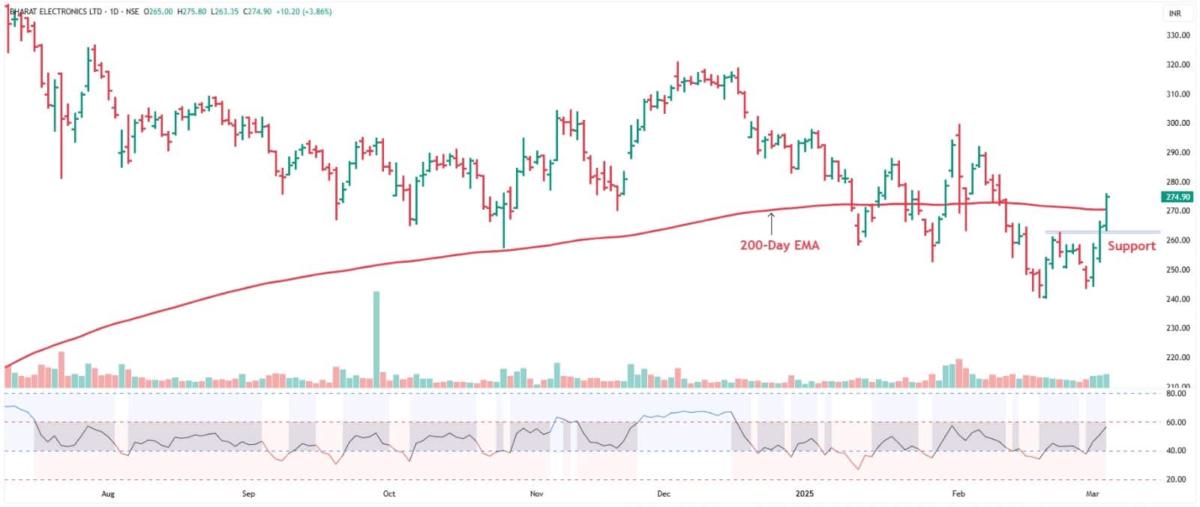
The stock of Bharat Electronics has been outperforming the frontline indices for the last couple of trading sessions. For the past three trading sessions, it has been witnessing strong bullish momentum along with above 50-day average volume. On Wednesday, the stock surged above its 200-day EMA level. Further, the daily RSI (Relative Strength Index) is about to surge above the 60 mark, and it is in rising mode.
The trend strength indicator, ADX (Average Directional Index), is quoting around 25.50 levels. The directional indicator is in buy mode as +DI surges above –DI. Hence, we recommend accumulating the stock in the zone of Rs 275–273, with a stop-loss of Rs 265. On the upside, it is likely to test the level of Rs 295 in the short term.
Strategy: Buy
Target: Rs 295
Stop-Loss: Rs 265
InterGlobe Aviation | CMP: Rs 4,698.1
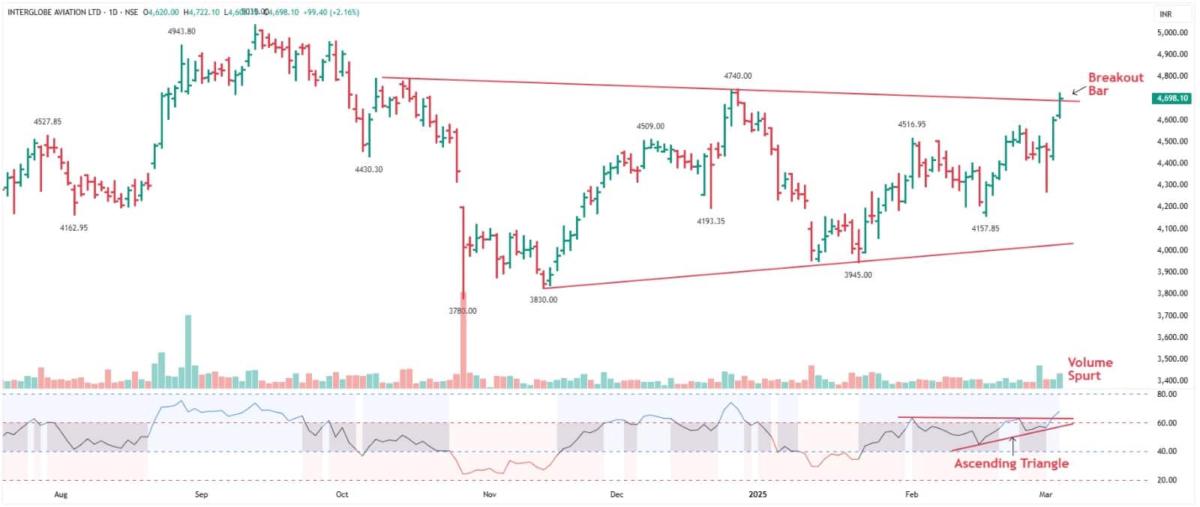
InterGlobe Aviation has been strongly outperforming the frontline indices for the last couple of weeks. On a daily scale, since the January month’s low, the stock has been marking a sequence of higher tops and higher bottoms. On Wednesday, the stock gave a downward-sloping trendline breakout on a daily scale. This breakout is confirmed by robust volume. Currently, the stock is trading above its short and long-term moving averages. These averages are in rising mode, and they are in the desired sequence, which suggests the trend is strong.
The daily RSI has given an Ascending Triangle breakout, which suggests strong bullish momentum. The MACD (Moving Average Convergence Divergence) stays bullish as it is quoting above the zero line and the signal line. Further, the MACD histogram is suggesting a pickup in upside momentum. Hence, we recommend accumulating the stock in the zone of Rs 4,700–4,670, with a stop-loss of Rs 4,540. On the upside, it is likely to test the level of Rs 5,020 in the short term.
Strategy: Buy
Target: Rs 5,020
Stop-Loss: Rs 4,540
Vidnyan S Sawant, Head of Research at GEPL Capital
Cholamandalam Investment and Finance Company | CMP: Rs 1,446.9

Cholamandalam Investment and Finance continues its upward trajectory, consistently forming higher bottoms and maintaining support above its key 12-month and 26-month EMAs, reinforcing its long-term bullish trend. On the weekly scale, the stock recently witnessed a triple-bottom neckline breakout, signaling strength as it continues to rise. Additionally, the formation of a base pattern on the daily chart further strengthens the bullish outlook. Momentum indicators also support the positive trend, with the MACD in buy mode and advancing above the zero line, indicating improving bullish momentum.
Strategy: Buy
Target: Rs 1,660
Stop-Loss: Rs 1,356
PFC | CMP: Rs 395.75
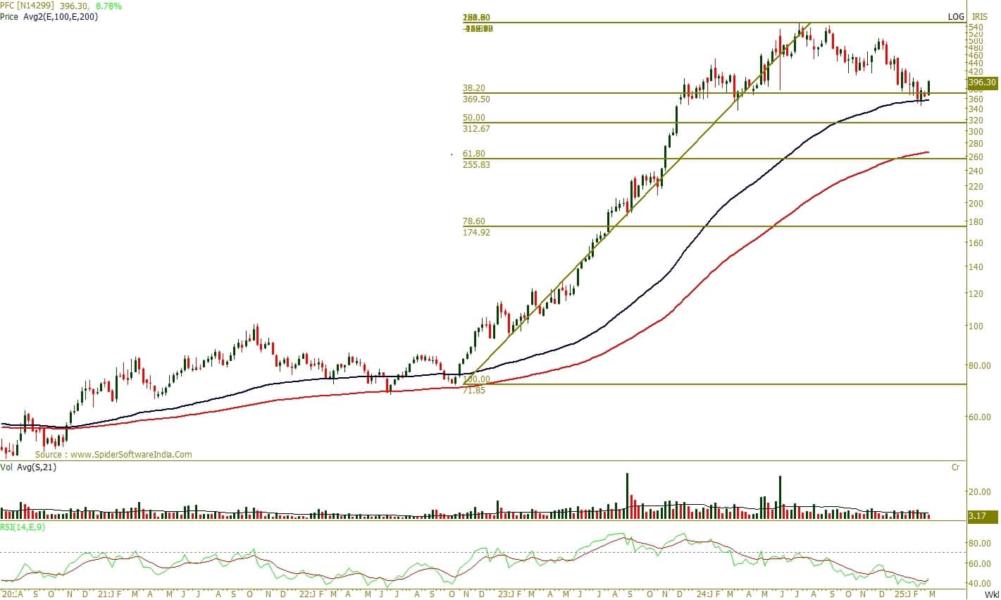
PFC remains in an uptrend on the monthly scale, finding strong support at the 38.2% Fibonacci retracement level. On the weekly chart, the stock has formed a double-bottom pattern and is exhibiting a bullish mean reversion from its 100-week EMA, further reinforcing its strength. Additionally, the RSI has shown a bullish crossover, rebounding from the oversold level of 40, highlighting a resurgence in bullish sentiment.
Strategy: Buy
Target: Rs 452
Stop-Loss: Rs 370
SBI Cards and Payment Services | CMP: Rs 844
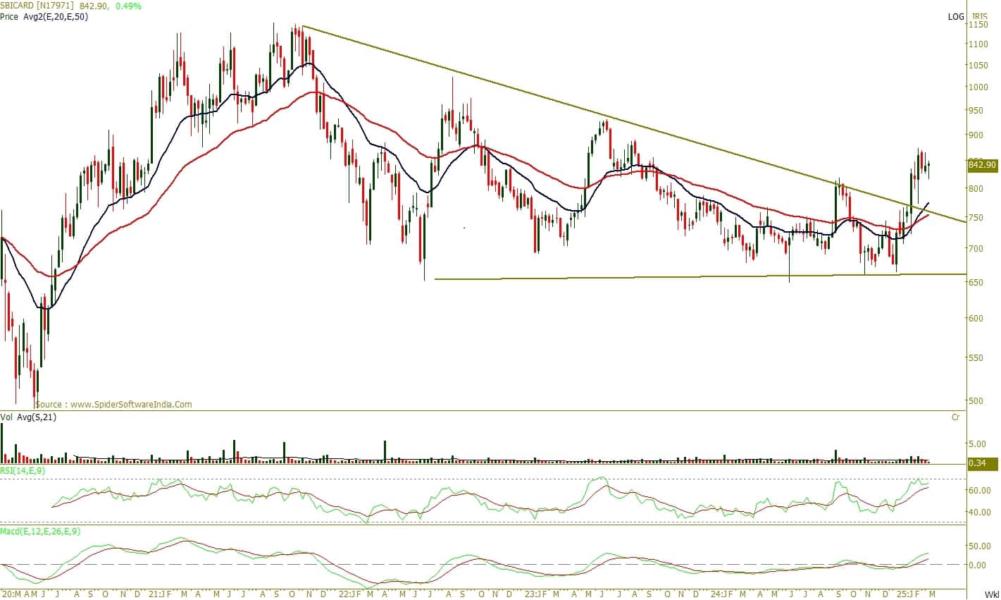
SBI Cards has shown a strong reversal on the weekly scale, breaking out from a multi-year sloping trend line originating from the 2021 swing high. On the daily chart, the stock is forming higher tops and higher bottoms, indicating strong relative strength against the broader market. Furthermore, the MACD is trending higher, while the RSI at 65 signals momentum acceleration, reinforcing the bullish outlook.
Strategy: Buy
Target: Rs 961
Stop-Loss: Rs 790
Kotak Mahindra Bank | CMP: Rs 1,933.1
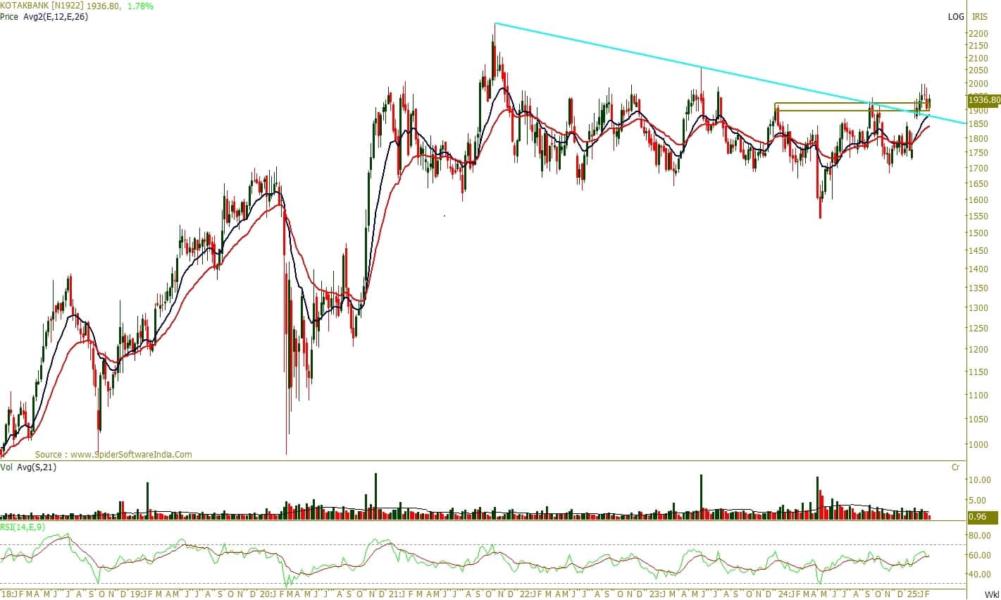
Kotak Mahindra Bank has witnessed a breakout on the monthly scale from a multi-year sloping trend line extending from the 2021 swing high, signaling robust structural development on a higher timeframe. On the weekly chart, the stock has exhibited a polarity shift, with the January 2024 and September 2024 swing tops acting as a support zone, further strengthening the bullish outlook. Additionally, the RSI at 60 on the weekly scale indicates improving bullish momentum.
Strategy: Buy
Target: Rs 2,170
Stop-Loss: Rs 1,840Disclaimer: The views and investment tips expressed by investment experts on Moneycontrol.com are their own and not those of the website or its management. Moneycontrol.com advises users to check with certified experts before taking any investment decisions.