OPEN-SOURCE SCRIPT
Keltner Channel Width Oscillator (KingThies)
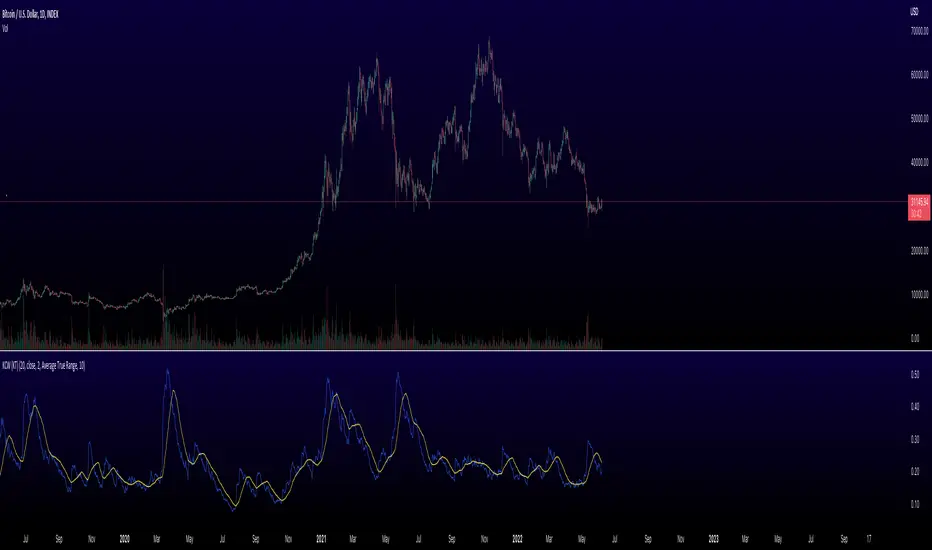
Definition
- The Keltner Channel Width oscillator is a technical analysis indicator derived originally from the same relationship the Bollinger Band Width indicator takes on Bollinger Bands.
Similar to the Bollinger Bands, Kelts measure volatility in relation to price, and factor in various range calculations to create three bands around the price of a given stock or digital asset. The Middle Line is typically a 20 Day Exponential Moving Average while the upper and lower bands highlight price at different range variations around its basis. Keltner Channel Width serve as a way to quantitatively measure the width between the Upper and Lower Bands and identify opportunities for entires and exits, based on the relative range price is experiencing that day.
Calculation
Kelt Channel Width = (Upper Band - Lower Band) / Middle Band
More on Keltner Channels - Keltner channel was first described by a Chicago grain trader called Chester W. Keltner in his 1960 book How to Make Money in Commodities. Though Keltner claimed no ownership of the original idea and simply called it the ten-day moving average trading rule, his name was applied by those who heard of this concept through his books.
Similarly to the Bollinger Bands, Keltner channel is a technical analysis tool based on three parallel lines. In fact, the Keltner indicator consists of a central moving average in addition to channel lines spread above and below it. The central line represents a 10-day simple moving average of what Chester W. Keltner called typical price. The typical price is defined as the average of the high, low and close. The distance between the central line and the upper, or lower line, is equivalent to the simple moving average of the preceding 10 days' trading ranges. - One way to interpret the Keltner Channel would be to consider the price breakouts outside of the channel. A trader would track price movement and consider any close above the upper line as a strong buy signal. Equivalently, any close below the lower line would be considered a strong sell signal. The trader would follow the trend emphasized by the indicator while complementing his analysis with the use of other indicators as well. However, the breakout method only works well when the market moves from a range-bound setting to an established trend. In a trend-less configuration, the Keltner Channel is better used as an overbought/oversold indicator. Thus, as the price breaks out below the lower band, a trader waits for the next close inside the Keltner Channel and considers this price behavior as an oversold situation indicating a potential buy signal. Similarly, as the price breaks out above the upper band, the trader waits for the next close inside the Keltner Channel and considers this price action as an overbought situation indicating a potential sell signal. By waiting for the price to close within the Channel, the trader avoids getting caught in a real upside or downside breakout.
Script open-source
In pieno spirito TradingView, il creatore di questo script lo ha reso open-source, in modo che i trader possano esaminarlo e verificarne la funzionalità. Complimenti all'autore! Sebbene sia possibile utilizzarlo gratuitamente, ricorda che la ripubblicazione del codice è soggetta al nostro Regolamento.
Eric Thies
Declinazione di responsabilità
Le informazioni ed i contenuti pubblicati non costituiscono in alcun modo una sollecitazione ad investire o ad operare nei mercati finanziari. Non sono inoltre fornite o supportate da TradingView. Maggiori dettagli nelle Condizioni d'uso.