OPEN-SOURCE SCRIPT
Gold Price Trend Overlay
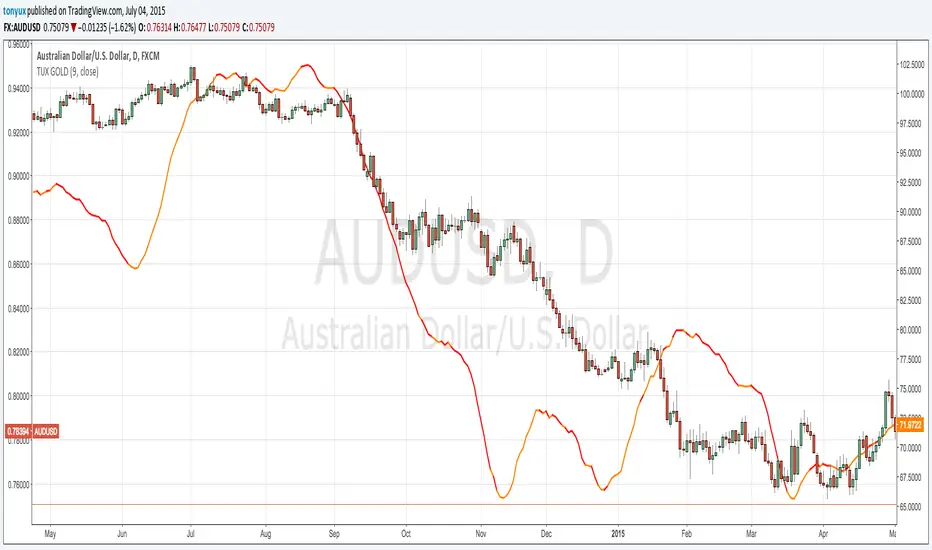
This chart overlay provides the daily 9 SMA of Gold.
If the price of GOLD is ABOVE the 9 SMA then the line will be GOLD
If the price of GOLD is BELOW the 9 SMA then the line will be RED
A good way to use this overlay is by understanding how Gold effects currency pairs.
if GOLD is BULLISH - then AUD/USD is BULLISH
if GOLD is BULLISH - then NZD/USD is BULLISH
if GOLD is BULLISH - then EUR/USD is BULLISH
if GOLD is BULLISH - then USD is bearish
if GOLD is BULLISH - then USD/CHF is BEARISH
if GOLD is BULLISH - then USD/CAD is BEARISH
Script open-source
In pieno spirito TradingView, il creatore di questo script lo ha reso open-source, in modo che i trader possano esaminarlo e verificarne la funzionalità. Complimenti all'autore! Sebbene sia possibile utilizzarlo gratuitamente, ricorda che la ripubblicazione del codice è soggetta al nostro Regolamento.
Declinazione di responsabilità
Le informazioni ed i contenuti pubblicati non costituiscono in alcun modo una sollecitazione ad investire o ad operare nei mercati finanziari. Non sono inoltre fornite o supportate da TradingView. Maggiori dettagli nelle Condizioni d'uso.