PROTECTED SOURCE SCRIPT
Aggiornato Daily, Weekly, Monthly Pivot Points Standard

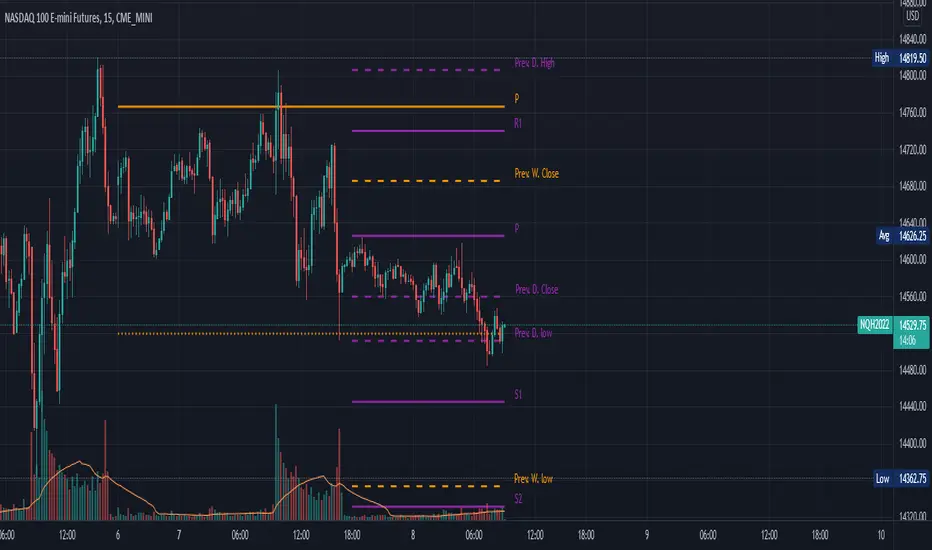
Show Higher timeframe Pivot Point along with 3 support/Resistance and mid line between them
Option to show the Monthly lines, with or without mid line, and can select the color
Option to show the Weekly lines, with or without mid line, and can select the color
Option to show the Daily lines, with or without mid line, and can select the color
Option to show a tables with the previous Open, High, Low, Close for these higher timeframe
Note di rilascio
Added Option to relocate the OHLC tableNote di rilascio
Added the OHLC lines instead of tableFixed the monthly line start for different exchange timezone
Price for lines are now shown on the right (where it's more useful to see it)
Note di rilascio
Update chartNote di rilascio
Added tooltipAdded HLC for all timeframe
Note di rilascio
Added option to show or not the price on linesNote di rilascio
Fixed a bug with the monthly lines not always working on different timeframeAdded Mid line for the Previous value (daily, weekly, monthly)
Added labels for the mid lines
Added tooltips
Script protetto
Questo script è pubblicato come codice protetto. Tuttavia, è possibile utilizzarle liberamente e senza alcuna limitazione – ulteriori informazioni qui.
Declinazione di responsabilità
Le informazioni e le pubblicazioni non sono intese come, e non costituiscono, consulenza o raccomandazioni finanziarie, di investimento, di trading o di altro tipo fornite o approvate da TradingView. Per ulteriori informazioni, consultare i Termini di utilizzo.