OPEN-SOURCE SCRIPT
Aggiornato Moving Average Channel and Elliott of BiznesFilosof
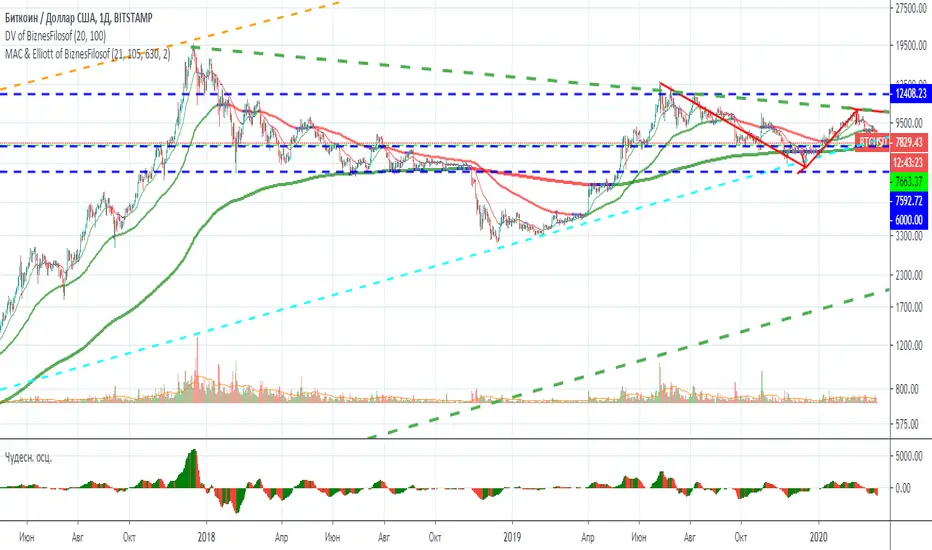
This indicator is based on my indicator "MAC of BiznesFilosof", but it differs in that it shows three waves. Daily, weekly and monthly wave. Based on the color of these waves, you can easily determine the trend to use the indicator in combination with oscillators.
The main idea of this indicator is ease of use. Although I made it possible to show the corridor in the settings, but I consider it more convenient when there is a minimum of heaps on the chart. The color of the moving average perfectly shows when overbought and oversold. The idea is that the asset value is slower than the price. And it helps to enter the transaction correctly.
More details will be on my channel in YouTube.
===
Этот индикатор создан на базе моего индикатора "MAC of BiznesFilosof", но он отличается тем, что показывает три волны. Волна дневная, недельная и месячная. На основании цвета этих волн можно легко определить тренд, чтобы использовать индикатор в сочетании с осциляторами.
Основная идея данного индикатора - это простота использования. Хоть я и сделал возможность в настройках показать коридор, но считаю более удобным, когда на графике минимум нагромождений. Цвет скользящей средней прекрасно показывает, когда перекупленность и перепроданность. Идея состоит в том, что ценность актива более медленная, чем цена. И это помогает правильно входить в сделку.
Больше подробностей будет на моём канале в Ютуб.
Note di rilascio
Corrected values suitable for Bitcoin. Also, by default, I put it on the exponent, because you need to look at the logarithmic scale.It will now be easier to predict waves.
===
Исправил значения, подходящие для Bitcoin. Также по умолчанию поставил на экспоненту, т.к. надо смотреть на логарифмической шкале.
Теперь будет проще предсказывать волны.
Script open-source
In pieno spirito TradingView, il creatore di questo script lo ha reso open-source, in modo che i trader possano esaminarlo e verificarne la funzionalità. Complimenti all'autore! Sebbene sia possibile utilizzarlo gratuitamente, ricorda che la ripubblicazione del codice è soggetta al nostro Regolamento.
Declinazione di responsabilità
Le informazioni ed i contenuti pubblicati non costituiscono in alcun modo una sollecitazione ad investire o ad operare nei mercati finanziari. Non sono inoltre fornite o supportate da TradingView. Maggiori dettagli nelle Condizioni d'uso.