OPEN-SOURCE SCRIPT
Parabolic (Brachistochrone) Curve Indicator
Overview of the Script
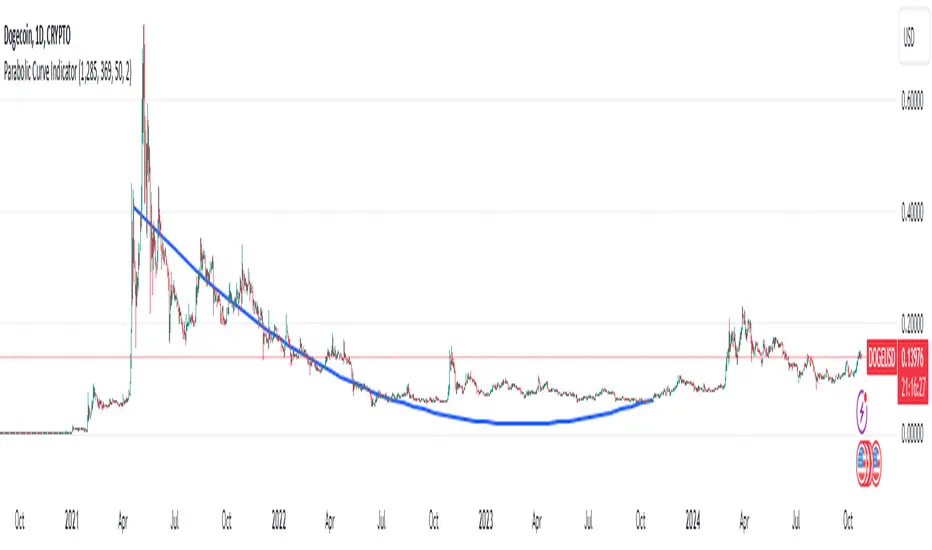
The script is designed to plot an approximation of the Brachistochrone curve between two points on a TradingView chart. The Brachistochrone curve represents the path of fastest descent under gravity between two points not aligned vertically. In physics, this curve is a segment of a cycloid.
Understanding the Brachistochrone Curve
Definition: The Brachistochrone curve is the curve along which a particle will descend from one point to another in the least time under gravity, without friction.
Mathematical Representation: The solution to the Brachistochrone problem is a cycloid, which is the curve traced by a point on the rim of a circular wheel as it rolls along a straight line.
Relevance to Trading: While the Brachistochrone curve originates from physics, plotting it on a price-time chart can offer a unique visual representation of the fastest possible movement between two price levels.
How the Script Works
Inputs
Start and End Bars:
startBar: The number of bars back from the current bar to define the starting point.
endBar: The number of bars back from the current bar to define the ending point.
Curve Customization:
numPoints: The number of points used to plot the curve (affects smoothness).
curveColor: The color of the curve.
curveWidth: The width of the curve lines.
Labels:
showTimeLabels: A toggle to display labels along the curve for reference.
Calculations
Determine Start and End Points:
The script calculates the coordinates (x_start, y_start, x_end, y_end) of the start and end points based on the specified bar offsets.
x_start and x_end correspond to bar indices (time).
y_start and y_end correspond to price levels.
Calculate Differences and Parameters:
Horizontal and Vertical Differences:
delta_x = x_end - x_start
delta_y = y_end - y_start
Ensure Descending Motion:
If the end point is higher than the start point (i.e., delta_y is positive), the script swaps the start and end points to ensure the curve represents a descent.
Cycloid Parameters:
Angle (theta): Calculated using theta = atan(delta_y / delta_x), representing the inclination of the curve.
Radius (R): The radius of the generating circle for the cycloid, calculated with R = delta_x / (π * cos(theta)).
Generate Points Along the Cycloid:
Parameter t: Varies from 0 to t_end, where t_end is set to π to represent half a cycloid (a common segment for the Brachistochrone).
Cycloid Equations:
Horizontal Component (x_t): x_t = R * (t - sin(t))
Vertical Component (y_t): y_t = R * (1 - cos(t))
Adjust Coordinates:
The script adjusts the cycloid coordinates to align with the chart's axes:
x_plot = x_start + x_t * cos(theta)
y_plot = y_start + y_t * sin(theta)
The x_plot values are converted to integer bar indices to match the chart's x-axis.
Plotting the Curve
Drawing Lines:
The script connects consecutive points using lines to form the curve.
It uses the line.new function, specifying the start and end coordinates of each line segment.
Adding Labels (Optional):
If showTimeLabels is enabled, the script places labels at intervals along the curve to indicate progress or parameter values.
Adjustments for Accurate Visualization
Handling Ascending Paths:
To adhere to the physical definition of the Brachistochrone curve, the script ensures that the ending point is below the starting point in terms of price.
If not, it swaps the points to represent a descending path.
Parameter Constraints:
The script ensures that calculations involving trigonometric functions remain within valid ranges to prevent mathematical errors (e.g., division by zero or invalid arguments for acos).
Scaling Considerations:
Adjustments are made to account for the differences in scaling between time (x-axis) and price (y-axis) on the chart.
The script maps spatial coordinates to the chart's axes appropriately.
Limitations and Considerations
Theoretical Nature:
The Brachistochrone curve is a theoretical concept from physics and doesn't necessarily predict actual price movements in financial markets.
Chart Scaling:
The visual appearance of the curve may be affected by the chart's scaling settings. Users may need to adjust the chart's zoom or scale to view the curve properly.
Data Range:
The start and end bars must be within the range of available data on the chart. If the specified bars are out of range, the script may not plot the curve.
Computational Limits:
TradingView imposes limits on the number of drawing objects (lines, labels) that can be displayed. The script accounts for this, but extremely high numPoints values may lead to performance issues.
Usage Instructions
Adding the Indicator:
The script is added to the chart as a custom indicator in TradingView's Pine Script Editor.
Configuring Inputs:
Start and End Bars: Users specify the bar offsets for the start and end points. It's important that the end point is below the start point in price to represent a descent.
Curve Customization: Users can adjust the number of points for smoothness and customize the curve's color and width.
Labels: Users can choose to display or hide labels along the curve.
Observing the Curve:
After configuring the inputs, the curve will be plotted between the two specified points.
Users can observe the curve to understand the theoretical fastest descent between the two price levels.
Potential Applications
Educational Tool:
The script serves as a visual aid to understand the properties of the Brachistochrone curve and cycloid.
Analytical Insights:
While not predictive, the curve might inspire new ways of thinking about price movements, momentum, or acceleration in markets.
Visualization:
It provides a unique way to visualize the relationship between time and price over a specific interval.
Conclusion
The script effectively adapts the mathematical concept of the Brachistochrone curve to a financial chart by carefully mapping spatial coordinates to time and price axes. By accounting for the unique characteristics of TradingView charts and implementing necessary mathematical adjustments, the script plots the curve between two user-defined points, offering a novel and educational visualization.
Script open-source
Nello spirito di TradingView, l'autore di questo script lo ha reso open source, in modo che i trader possano esaminarne e verificarne la funzionalità. Complimenti all'autore! Sebbene sia possibile utilizzarlo gratuitamente, ricordiamo che la ripubblicazione del codice è soggetta al nostro Regolamento.
Declinazione di responsabilità
Le informazioni e le pubblicazioni non sono intese come, e non costituiscono, consulenza o raccomandazioni finanziarie, di investimento, di trading o di altro tipo fornite o approvate da TradingView. Per ulteriori informazioni, consultare i Termini di utilizzo.