OPEN-SOURCE SCRIPT
Ichimoku Cloud Strategy v2.0
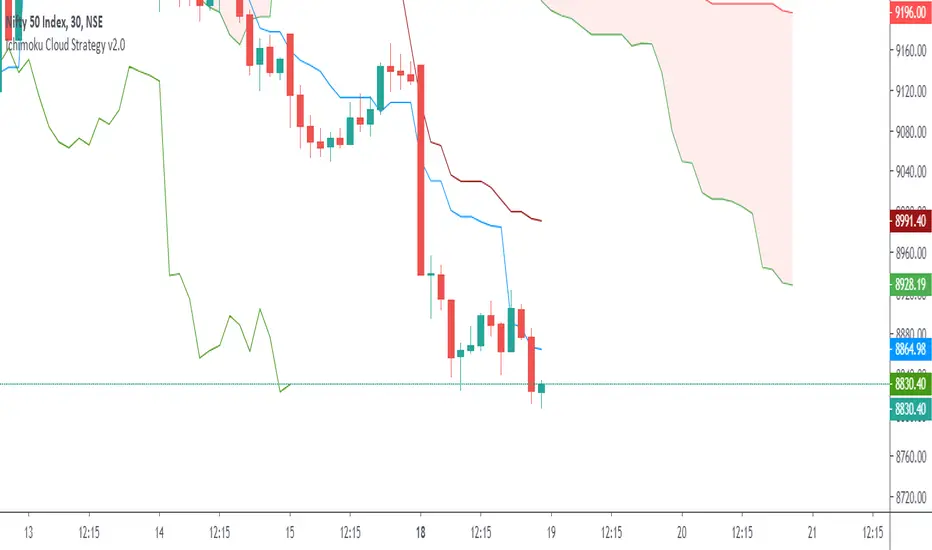
Trend following trading strategy “Ichimoku Crossover” is a popular Ichimoku trading strategy that uses the cloud and crossover of two base lines to define the market reverse point. Ichimoku crossover trading strategy has appeared to be a profitable trading strategy.
The indicator has 5 base lines and to read Ichimoku indicator it is required to understand the meaning of these lines first of all:
Tenkan-Sen line, also called the Conversion Line, represents the midpoint of the last 9 candlesticks . It is calculated with the following Ichimoku formula: .
Kijun-Sen line, also called the Base Line, represents the midpoint of the last 26 candlesticks . It is calculated with the following formula: .
Chiou Span, also called the Lagging Span, lags behind the price (as the name suggests). The Lagging Span is plotted 26 periods back.
Senkou Span A, also called the Leading Span A, represents one of the two Cloud boundaries and it’s the midpoint between the Conversion Line and the Base Line: . This value is plotted 26 periods into the future and it’s the faster Cloud boundary.
Senkou Span B, or the Leading Span B, represents the second Cloud boundaries and it’s the midpoint of the last 52 price bars: . This value is plotted 52 periods into the future and it is the slower Cloud boundary.
Trading with Ichimoku is very simple.
The Conversion Line needs to break above the Base Line. This will be a buy signal.
For a bearish (sell) signal a trader should wait for the Conversion line crosses the Base line downwards it is a sell signal.
Script open-source
In pieno spirito TradingView, il creatore di questo script lo ha reso open-source, in modo che i trader possano esaminarlo e verificarne la funzionalità. Complimenti all'autore! Sebbene sia possibile utilizzarlo gratuitamente, ricorda che la ripubblicazione del codice è soggetta al nostro Regolamento.
Declinazione di responsabilità
Le informazioni ed i contenuti pubblicati non costituiscono in alcun modo una sollecitazione ad investire o ad operare nei mercati finanziari. Non sono inoltre fornite o supportate da TradingView. Maggiori dettagli nelle Condizioni d'uso.