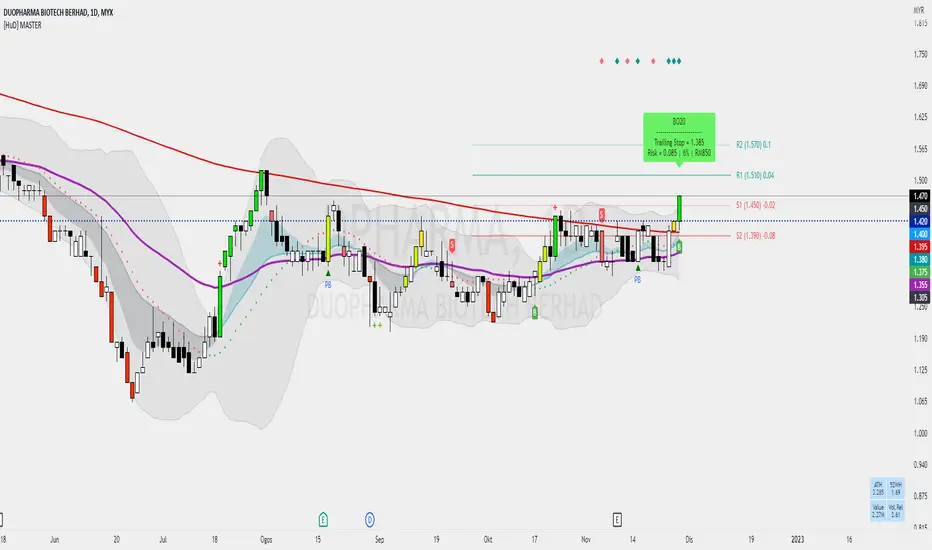
[HuD] Master

1️⃣ Two EMA lines are used to create the band, which are EMA 8 and EMA 21
When EMA 8 value > EMA21 value, the band color is filled with green and when EMA 8 < EMA21, band is grey
Green means uptrend mode and grey downtrend mode.
2️⃣ EMA50 (purple color)
EMA50 act as a trend indicator, which indicates whether the chart is uptrend or downtrend
3️⃣ Simple Moving Average (SMA200), red line act as a long-term trend guide.
Chart is in strong uptrend when candles are above EMA50 and SMA200
4️⃣ There are 5 signals generated that act as signals to help traders (Bursa Malaysia) in making decisions for Long position.
🔸BUY Signal (B) and SELL (S)
- generated using ATR with default setting set to, ATR Length = 20 , and ATR Multification = 1.7
- trader can make Buy position from that candle or monitor and enter enter after few candle after BUY Signal
- SELL (S) signal is exit signal = red candle, when it break ATR Trailing stop
🔸PB Signal
- signal generated using Stochastic and when candle rebound from EMA10, EMA20 and EMA50
- this is the most safest Entry since it nearest to support area
🔸BO5 ( Light Green Candle )
- When candle breakout the highest previous five candles with significant volume
- Indicates that there's a sign of interest in buying power in the market
- Another opportunity to enter the market either at the current candle or wait for the right time when it retraces
🔸BO20 ( Green Candle )
- When candle breakout the highest previous twenty candles with significant volume
- In daily chart this candle is consider very important as it is the highest monthly candle.
v. ATOM ( Yellow Candle )
- when candle able to break the LineAtom
- LineAtom = sma (close, 20) + (1 * stdev(close, 20))
- ATOM candle indicates there is momentum for candle to move forward towards Top BB
5️⃣ Other Features from Indicator :
🔹Built-in Gann Lines
- Gann Lines is generated from the calculation and reference of Gann Square 9 Table
- It act as a guide for support and resistance .
- Exit position when it breaks the support or as Take Profit (TP) when it reaches the desired resistance.
🔹Tables
- showing the value of All Time High and 52-Week-High
- show the estimation value of current trade ( volume * close price )
- show the value of volume relative
🔹Golden Cross and Death Cross
- act as guide when there's a crossing between short EMA and long EMA lines
- Below are pair of EMAs used :
🔘EMA5 and EMA20
🔘EMA20 and EMA50
🔘EMA50 and SMA200
Solid Line = Stronger Resistance/Support
Dashed Line = Resistance/Support
Script su invito
Solo gli utenti approvati dall'autore possono accedere a questo script. È necessario richiedere e ottenere l'autorizzazione per utilizzarlo. Tale autorizzazione viene solitamente concessa dopo il pagamento. Per ulteriori dettagli, seguire le istruzioni dell'autore riportate di seguito o contattare direttamente Hud_Hud.
TradingView NON consiglia di pagare o utilizzare uno script a meno che non ci si fidi pienamente del suo autore e non si comprenda il suo funzionamento. Puoi anche trovare alternative gratuite e open-source nei nostri script della comunità.
Istruzioni dell'autore
Telegram Channel : t.me/HudHudAlert
TV Indicator : my.tradingview.com/u/Hud_Hud/
Declinazione di responsabilità
Script su invito
Solo gli utenti approvati dall'autore possono accedere a questo script. È necessario richiedere e ottenere l'autorizzazione per utilizzarlo. Tale autorizzazione viene solitamente concessa dopo il pagamento. Per ulteriori dettagli, seguire le istruzioni dell'autore riportate di seguito o contattare direttamente Hud_Hud.
TradingView NON consiglia di pagare o utilizzare uno script a meno che non ci si fidi pienamente del suo autore e non si comprenda il suo funzionamento. Puoi anche trovare alternative gratuite e open-source nei nostri script della comunità.
Istruzioni dell'autore
Telegram Channel : t.me/HudHudAlert
TV Indicator : my.tradingview.com/u/Hud_Hud/