OPEN-SOURCE SCRIPT
[OCT] Moving Average Sigmoid Variance
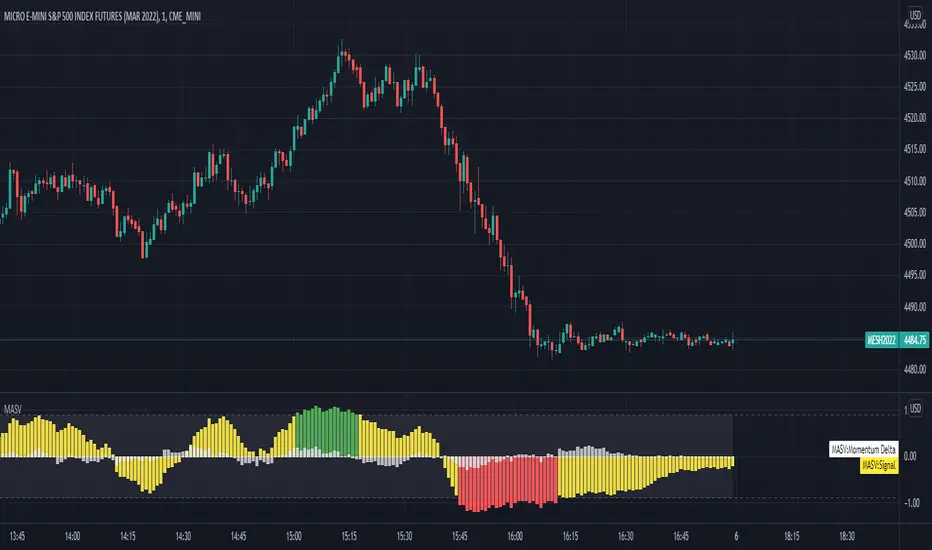
Uses a weighted sigmoid function to gauge the difference between two moving averages. Useful as an additional confirmation source for following trends.
The signal line hovers between -1 and 1, -1 being a negative delta and 1 being a positive delta.
Using a minimum and maximum threshold, a trend can be identified based on how far the signal line crosses the thresholds.
The signal is optionally (enabled by default) adjusted by a "momentum", which is calculated as a moving average of the *change* of a value over time. It's a bit finicky to describe, so please take a look at how it's calculated in code if you wish to use it.
The signal, by default, is green when the value is above the threshold, red when it's below the threshold, and yellow when inside the threshold.
NOTE:
This study is extremely untuned and should not be used as the sole inspiration for taking or exiting a position out of the box.
Please play around with the many available configuration options to fine tune the output to fit your personal strategy.
Configurable options:
- All colors
- All moving average algorithms
- All moving average sources
- All moving average lengths
- Threshold values
- Signal and momentum multipliers
- Whether or not to use the momentum
- Whether or not to plot the momentum
Script open-source
In pieno spirito TradingView, il creatore di questo script lo ha reso open-source, in modo che i trader possano esaminarlo e verificarne la funzionalità. Complimenti all'autore! Sebbene sia possibile utilizzarlo gratuitamente, ricorda che la ripubblicazione del codice è soggetta al nostro Regolamento.
Declinazione di responsabilità
Le informazioni ed i contenuti pubblicati non costituiscono in alcun modo una sollecitazione ad investire o ad operare nei mercati finanziari. Non sono inoltre fornite o supportate da TradingView. Maggiori dettagli nelle Condizioni d'uso.