PROTECTED SOURCE SCRIPT
Wave Collapse Simulation - Confirmation of New Trend
This Pine Script, titled "Wave Collapse Simulation - Confirmation of New Trend," is an advanced indicator designed to identify high-conviction trend changes. It operates on the principle of a "wave collapse," a metaphor for a moment when market uncertainty resolves into a new, confirmed direction. It identifies these moments by combining signals from market structure, trend-following moving averages, and a spike in volatility. The indicator plots its signals directly on the price chart
The core idea is that a stable trend (making higher highs and higher lows, or vice-versa) will eventually fail. This script pinpoints the exact moment this failure is confirmed by a significant price move that breaks key levels, signaling the start of a new trend.
Key Components
1. Multi-Length Pivot Analysis
Instead of relying on a single lookback period, the script analyzes market structure using up to ten different pivot lengths (e.g., 2, 3, 5, 7, 11...).
Structural Failure: It constantly monitors these pivots to see if the market fails to make a new higher high in an uptrend (higherHighsFailed) or a new lower low in a downtrend (lowerLowsFailed). A failure in this pattern is the first sign that the prevailing trend is weakening.
2. Trend Context and Volatility Trigger
The script uses two additional components to validate a potential trend change:
Long-Term Trend: Two slow-moving averages (999 and 3000 periods) are used to establish the dominant, long-term trend direction. A signal can only occur if it aligns with a break of this established trend.
Volatility Spike: It uses the Average True Range (ATR) to detect a sudden, powerful price movement. A "collapse" is only considered valid if the price moves more than a specified multiple of the ATR, ensuring the signal is backed by significant market force and not just noise.
3. The "Collapse" Event
This is the central logic of the indicator. A bullish or bearish collapse is a high-probability signal triggered only when three specific conditions are met simultaneously:
Bullish Collapse (New Uptrend):
Structure: The market has failed to make new lower lows.
Trend Break: The price breaks above the short-term moving average during a long-term downtrend.
Volatility: The move is accompanied by a significant volatility spike.
Bearish Collapse (New Downtrend):
Structure: The market has failed to make new higher highs.
Trend Break: The price breaks below the short-term moving average during a long-term uptrend.
Volatility: The move is accompanied by a significant volatility spike.
4. Gaussian Probability Simulation
The script includes a Gaussian (normal distribution) function to model market certainty.
Sigma (σ): This variable represents the standard deviation, or "uncertainty." After a collapse event, sigma is reset to a very small value, representing a moment of high certainty about the new trend.
Decay: If no new collapse occurs, sigma gradually increases with each bar, representing the return of uncertainty to the market. While the script calculates the probabilities for a price distribution (the "wave"), its primary function is to use the state of sigma to define the collapse event itself, rather than plotting a visual wave.
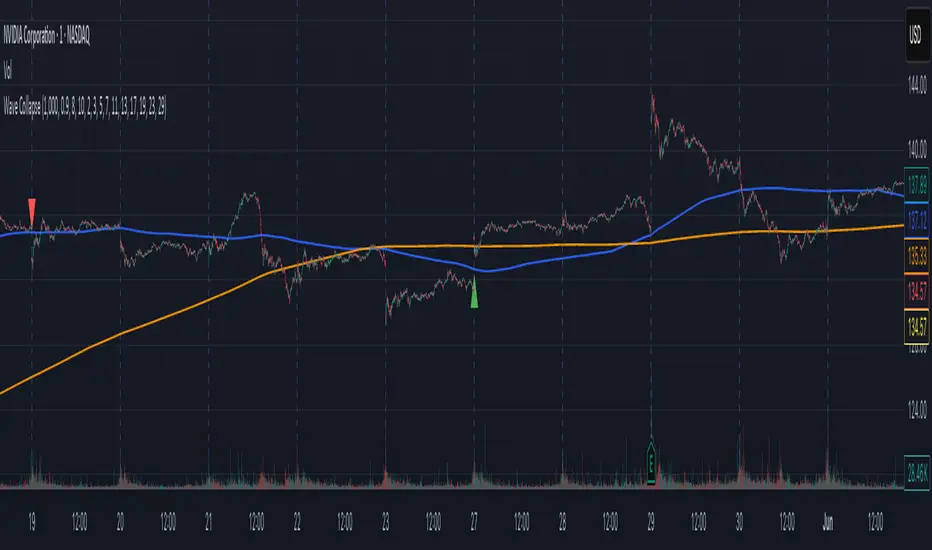
How It Appears on the Chart
Moving Averages: The long-term maShort (blue) and maLong (orange) are plotted to show the underlying trend context.
Collapse Signals:
A green triangle is plotted below the price bar to signal a Bullish Collapse.
A red triangle is plotted above the price bar to signal a Bearish Collapse.
Collapse Price: A horizontal red line appears at the price where the collapse was triggered, serving as a key reference level for the new trend.


The core idea is that a stable trend (making higher highs and higher lows, or vice-versa) will eventually fail. This script pinpoints the exact moment this failure is confirmed by a significant price move that breaks key levels, signaling the start of a new trend.
Key Components
1. Multi-Length Pivot Analysis
Instead of relying on a single lookback period, the script analyzes market structure using up to ten different pivot lengths (e.g., 2, 3, 5, 7, 11...).
Structural Failure: It constantly monitors these pivots to see if the market fails to make a new higher high in an uptrend (higherHighsFailed) or a new lower low in a downtrend (lowerLowsFailed). A failure in this pattern is the first sign that the prevailing trend is weakening.
2. Trend Context and Volatility Trigger
The script uses two additional components to validate a potential trend change:
Long-Term Trend: Two slow-moving averages (999 and 3000 periods) are used to establish the dominant, long-term trend direction. A signal can only occur if it aligns with a break of this established trend.
Volatility Spike: It uses the Average True Range (ATR) to detect a sudden, powerful price movement. A "collapse" is only considered valid if the price moves more than a specified multiple of the ATR, ensuring the signal is backed by significant market force and not just noise.
3. The "Collapse" Event
This is the central logic of the indicator. A bullish or bearish collapse is a high-probability signal triggered only when three specific conditions are met simultaneously:
Bullish Collapse (New Uptrend):
Structure: The market has failed to make new lower lows.
Trend Break: The price breaks above the short-term moving average during a long-term downtrend.
Volatility: The move is accompanied by a significant volatility spike.
Bearish Collapse (New Downtrend):
Structure: The market has failed to make new higher highs.
Trend Break: The price breaks below the short-term moving average during a long-term uptrend.
Volatility: The move is accompanied by a significant volatility spike.
4. Gaussian Probability Simulation
The script includes a Gaussian (normal distribution) function to model market certainty.
Sigma (σ): This variable represents the standard deviation, or "uncertainty." After a collapse event, sigma is reset to a very small value, representing a moment of high certainty about the new trend.
Decay: If no new collapse occurs, sigma gradually increases with each bar, representing the return of uncertainty to the market. While the script calculates the probabilities for a price distribution (the "wave"), its primary function is to use the state of sigma to define the collapse event itself, rather than plotting a visual wave.
How It Appears on the Chart
Moving Averages: The long-term maShort (blue) and maLong (orange) are plotted to show the underlying trend context.
Collapse Signals:
A green triangle is plotted below the price bar to signal a Bullish Collapse.
A red triangle is plotted above the price bar to signal a Bearish Collapse.
Collapse Price: A horizontal red line appears at the price where the collapse was triggered, serving as a key reference level for the new trend.
Script protetto
Questo script è pubblicato come codice protetto. Tuttavia, è possibile utilizzarle liberamente e senza alcuna limitazione – ulteriori informazioni qui.
Declinazione di responsabilità
Le informazioni e le pubblicazioni non sono intese come, e non costituiscono, consulenza o raccomandazioni finanziarie, di investimento, di trading o di altro tipo fornite o approvate da TradingView. Per ulteriori informazioni, consultare i Termini di utilizzo.