OPEN-SOURCE SCRIPT
WAMI Strategy
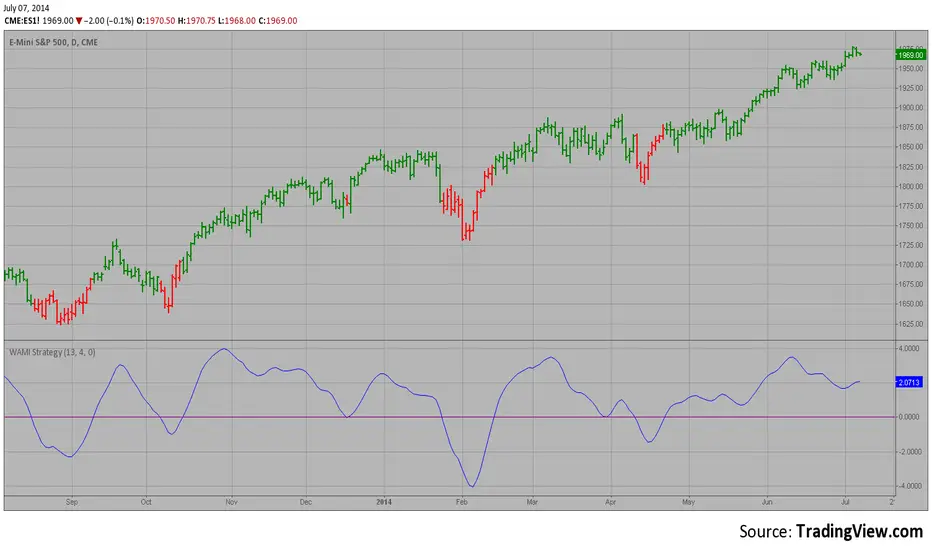
The WAMI-based trading lies in the application and iteration of the
optimization process until the indicated trades on past market data
give consistent, profitable results. It is rather difficult process
based on Fourier analysis.
You can to change Trigger parameter for to get best values of strategy.
optimization process until the indicated trades on past market data
give consistent, profitable results. It is rather difficult process
based on Fourier analysis.
You can to change Trigger parameter for to get best values of strategy.
Script open-source
In pieno spirito TradingView, il creatore di questo script lo ha reso open-source, in modo che i trader possano esaminarlo e verificarne la funzionalità. Complimenti all'autore! Sebbene sia possibile utilizzarlo gratuitamente, ricorda che la ripubblicazione del codice è soggetta al nostro Regolamento.
Declinazione di responsabilità
Le informazioni ed i contenuti pubblicati non costituiscono in alcun modo una sollecitazione ad investire o ad operare nei mercati finanziari. Non sono inoltre fornite o supportate da TradingView. Maggiori dettagli nelle Condizioni d'uso.