PROTECTED SOURCE SCRIPT
Support & Resistance Zones
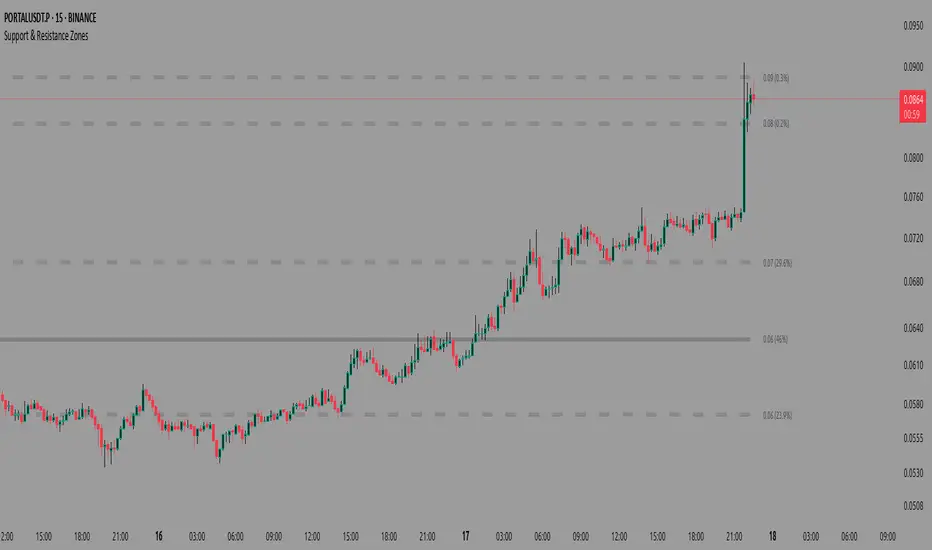
Advanced Support & Resistance Detection Algorithm
This indicator identifies meaningful price levels by analyzing market structure using a proprietary statistical approach. Unlike traditional methods that rely on simple swing highs/lows or moving averages, this system dynamically detects zones where price has shown consistent interaction, revealing true areas of supply and demand.
Core Methodology
Price Data Aggregation
Collects highs and lows over a configurable lookback period.
Normalizes price data to account for volatility, ensuring levels remain relevant across different market conditions.
Statistical Significance Filtering
Rejection of random noise: Eliminates insignificant price fluctuations using adaptive thresholds.
Volume-weighted analysis (implied): Stronger reactions at certain price levels are given higher priority, even if volume data is unavailable.
Dynamic Level Extraction
Density-based S/R Zones: Instead of fixed swing points, the algorithm identifies zones where price has repeatedly consolidated.
Time decay adjustment: Recent price action has more influence, ensuring levels adapt to evolving market structure.
Strength Quantification
Each level is assigned a confidence score based on:
Touch frequency: How often price revisited the zone.
Reaction intensity: The magnitude of bounces/rejections.
Time relevance: Whether the level remains active or has been broken decisively.
Adaptive Level Merging & Pruning
Proximity-based merging: If two levels are too close (within a volatility-adjusted threshold), they combine into one stronger zone.
Decay mechanism: Old, untested levels fade away if price no longer respects them.
Why This Approach Works Better Than Traditional Methods
✅ No subjective drawing required – Levels are generated mathematically, removing human bias.
✅ Self-adjusting sensitivity – Works equally well on slow and fast-moving markets.
✅ Focuses on statistically meaningful zones – Avoids false signals from random noise.
✅ Non-repainting & real-time – Levels only update when new data confirms their validity.
How Traders Can Use These Levels
Support/Resistance Trading: Fade bounces off strong levels or trade breakouts with confirmation.
Confluence with Other Indicators: Combine with RSI, MACD, or volume profiles for higher-probability entries.
Stop Placement: Place stops just beyond key levels to avoid premature exits.
Technical Notes (For Advanced Users)
The algorithm avoids overfitting by dynamically adjusting zones sensitivity based on market conditions.
Unlike fixed pivot points, these levels adapt to trends, making them useful in both ranging and trending markets.
The strength percentage helps filter out weak levels—only trade those with a high score for better accuracy.
Note: Script takes some time to load.
Script protetto
Questo script è pubblicato come codice protetto. Tuttavia, è possibile utilizzarle liberamente e senza alcuna limitazione – ulteriori informazioni qui.
Declinazione di responsabilità
Le informazioni e le pubblicazioni non sono intese come, e non costituiscono, consulenza o raccomandazioni finanziarie, di investimento, di trading o di altro tipo fornite o approvate da TradingView. Per ulteriori informazioni, consultare i Termini di utilizzo.