PROTECTED SOURCE SCRIPT
above or below closing after previous candel trend
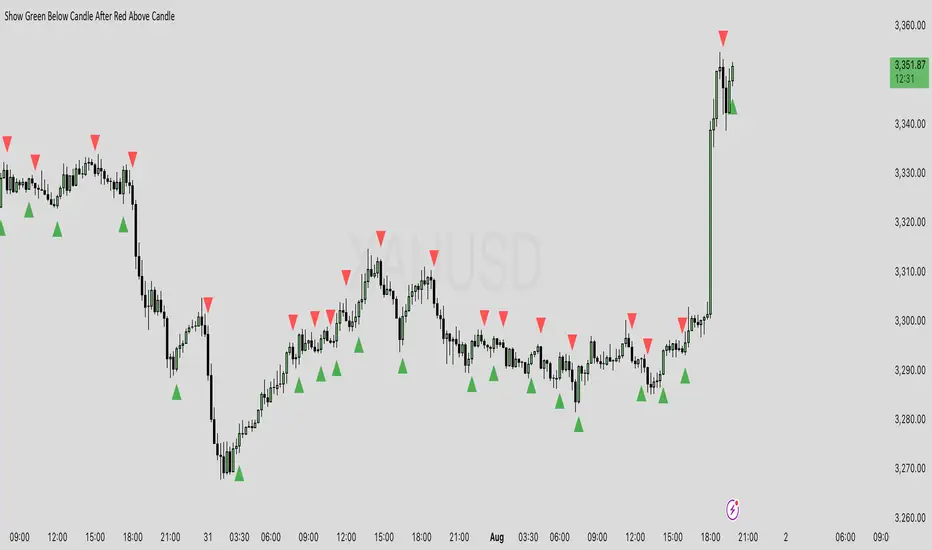
Strategy Explanation: "Show Green Arrow Below Candle After Red Arrow Above Candle"
This indicator highlights specific trading conditions on a chart using red and green arrows based on the relationship between a candle's closing price and the previous candle's high and low. Its primary purpose is to provide visual cues for potential reversal points or trend continuation opportunities without redundancy (avoiding consecutive signals).
How the Indicator Works:
Red Arrow (Above the Candle):
A red downward arrow is plotted above a candle when the current candle closes below the previous candle's low.
The red arrow signals a potential bearish movement or downward breakout, indicating weakness in price action.
Green Arrow (Below the Candle):
A green upward arrow is plotted below a candle when the current candle closes above the previous candle's high.
However, a green arrow only appears after a red arrow, indicating a potential bullish reversal or upward breakout following bearish price action.
Avoiding Redundant Signals:
The script ensures that there are no consecutive signals of the same color:
No consecutive green arrows are displayed even if multiple candles close above their respective highs.
No consecutive red arrows are displayed even if multiple candles close below their respective lows.
This prevents unnecessary clutter on the chart and focuses solely on transitions from bearish to bullish signals.
Trading Interpretation:
Red Arrows (Bearish Signal):
A red arrow indicates a bearish sentiment, as the current candle closes below the previous low. This may indicate a potential area to:
Initiate a short position if it aligns with your trading strategy.
Exercise caution and wait for the next signal if you’re already holding a long position.
Green Arrows (Bullish Reversal):
A green arrow signals bullish strength, as the current candle closes above the previous high, but only after price has shown bearish weakness (i.e., a red arrow). This may be a good area to:
Initiate a long position if it aligns with your strategy.
Look for signs of trend reversal or upside confirmation.
Scenarios to Use This Indicator:
This indicator fits well when trying to identify key moments of trend reversals or significant breakout levels. For instance:
Trend Reversal:
A red arrow may indicate the start of bearish momentum.
The first green arrow after the red arrow might signal a reversal from bearish to bullish momentum.
Consolidation and Breakout:
This indicator can help identify situations where price closes decisively above or below key points (previous highs/lows), which can suggest either breakout trades or fakeout signals depending on market reaction.
When NOT to Use This Indicator:
In highly choppy or ranging markets, where price action constantly oscillates above and below the previous high or low without establishing a clear trend. This can lead to false signals and poor trade setups because the market lacks a directional bias.
Best Practices:
Combine with Other Indicators:
Use this indicator in combination with trend-following indicators like Moving Averages, RSI (Relative Strength Index), or Bollinger Bands for confirmation.
Pair it with support and resistance levels to identify high-probability entries.
Adjust to Your Trading Style:
Day Traders: Use this on smaller timeframes (e.g., 5-minute, 15-minute).
Swing Traders: Use this on higher timeframes for stronger signals (e.g., hourly, daily).
Risk Management:
Always set stop-loss levels based on recent highs/lows or volatility metrics.
Position size appropriately to manage risk for potential false signals.
Summary of the Indicator Logic:
Plots red arrows above candles when:
The candle closes below the previous candle’s low.
Plots green arrows below candles when:
The candle closes above the previous candle’s high.
Only after a red arrow has appeared (no redundant green arrows).
Ensures no consecutive red or green arrows, focusing only on signal transitions (red → green).
This indicator helps traders identify potential trend changes and breakout points without cluttering the chart with excessive signals, making it a clean and straightforward addition to any trading strategy.
Script protetto
Questo script è pubblicato come codice protetto. Tuttavia, è possibile utilizzarle liberamente e senza alcuna limitazione – ulteriori informazioni qui.
Declinazione di responsabilità
Le informazioni e le pubblicazioni non sono intese come, e non costituiscono, consulenza o raccomandazioni finanziarie, di investimento, di trading o di altro tipo fornite o approvate da TradingView. Per ulteriori informazioni, consultare i Termini di utilizzo.