PROTECTED SOURCE SCRIPT
𝙷✪𝚕𝚍𝚎𝚖 [Enhanced MULTI MA Dashboard v7.2]
𝙷✪𝚕𝚍𝚎𝚖 — Enhanced MULTI MA Dashboard v7.2
What it does
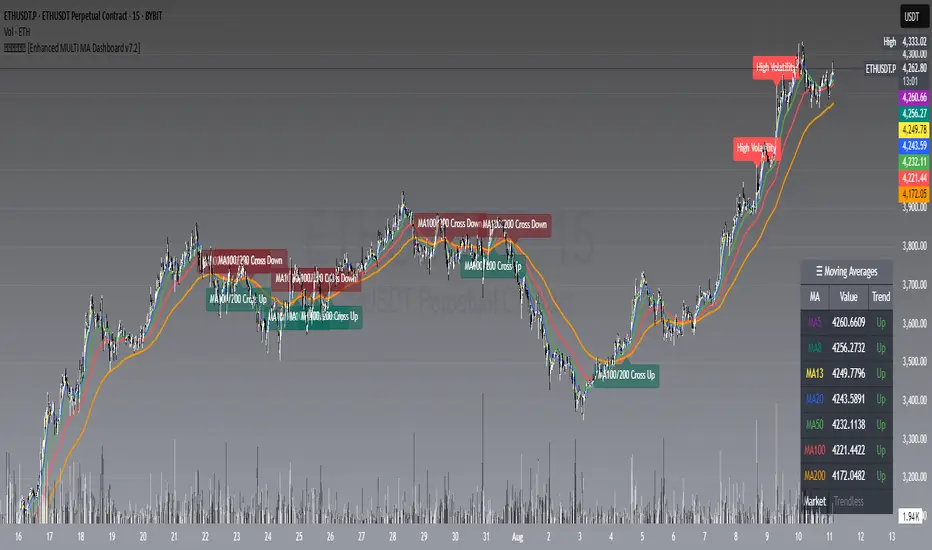
A complete moving-average control center that overlays up to seven MAs (5/8/13/20/50/100/200), draws dynamic MA clouds between consecutive pairs, tags crossover events (optional), and shows a compact on-chart dashboard with each MA’s current value and slope-based trend (Up/Down/Flat). It also detects Trendless and High-Volatility regimes to help you adapt your strategy.
Key Features
7 Configurable Moving Averages
- Turn each MA on/off individually (5, 8, 13, 20, 50, 100, 200).
- Choose type per MA: SMA, EMA, WMA, HMA, VWMA.
- Set lengths freely and color each line.
- Works on any symbol and timeframe; source selectable (close/open/high/low, etc.).
☁︎ MA Clouds (optional)
- Shaded cloud between each consecutive pair (5–8, 8–13, 13–20, 20–50, 50–100, 100–200).
- Cloud auto-colors toward the currently dominant MA (above/below) with adjustable transparency.
- Quick visual read of short- vs long-side control and compression/expansion.
⚠️ Market Regime Detection
- Trendless: measures how tightly short MAs (5, 8, 13) are clustered using std-dev % of their values; user-set threshold.
- High Volatility: flags when ATR(Length) > ATR SMA × Multiplier.
- Optional background tint and chart labels when regimes flip.
- Dashboard cell shows Trending / Trendless / High Volatility with color coding.
➕ Crossover Signal Labels (fully granular)
- Toggle labels for any pair you care about (e.g., 5/8, 8/20, 50/200, etc.).
- Separate styles/colors for Cross Up and Cross Down; adjustable label size.
- Great for momentum shifts, golden/death cross style monitoring, or timing add/reduce decisions.
- (Note: these are visual labels; no alertconditions are defined.)
📊 On-Chart MA Dashboard
- Compact, movable table (Top/Bottom/Middle, Left/Right/Center).
- Columns: MA name, current value, trend direction (derived from MA slope).
- Customizable text size, header text, colors, background, optional alternating row colors, and border styling.
- Auto-adds a Market row when regime detection is enabled.
How to Use
1 Pick your data source (close by default) and switch on the MAs you care about.
2 Choose MA types and lengths to match your system (e.g., EMA for reactivity, SMA for smoothing).
3 Enable MA Clouds to see compression/expansion and dominance at a glance.
4 Set regime thresholds:
- Lower Trendless Threshold → stricter definition of chop.
- Raise ATR Multiplier → fewer, “truer” high-volatility flags.
5 Activate specific crossovers that fit your playbook (e.g., 5/20 for short-term momentum, 50/200 for cycle turns).
6 Position and style the dashboard so it stays readable on your layout.
Signal & Reading Guide
- Trend column (Up/Down/Flat) reflects the slope of each MA (today vs previous bar).
- Cloud flips (color dominance changes) often precede or confirm crossover labels.
- Trendless suggests range conditions; consider mean-reversion tools or stand aside.
- High Volatility calls for wider stops or volatility-aware sizing; breakouts can travel farther.
Disclaimer
This tool is for education and visualization. It does not constitute financial advice and is not a buy/sell system by itself. Always validate signals within your broader risk-managed plan.
Script protetto
Questo script è pubblicato come codice protetto. Tuttavia, è possibile utilizzarle liberamente e senza alcuna limitazione – ulteriori informazioni qui.
𝙷✪𝚕𝚍𝚎m
Declinazione di responsabilità
Le informazioni e le pubblicazioni non sono intese come, e non costituiscono, consulenza o raccomandazioni finanziarie, di investimento, di trading o di altro tipo fornite o approvate da TradingView. Per ulteriori informazioni, consultare i Termini di utilizzo.