PROTECTED SOURCE SCRIPT
Aggiornato Bullish Auto Fibs
Bullish Auto Fibs Indicator
Description
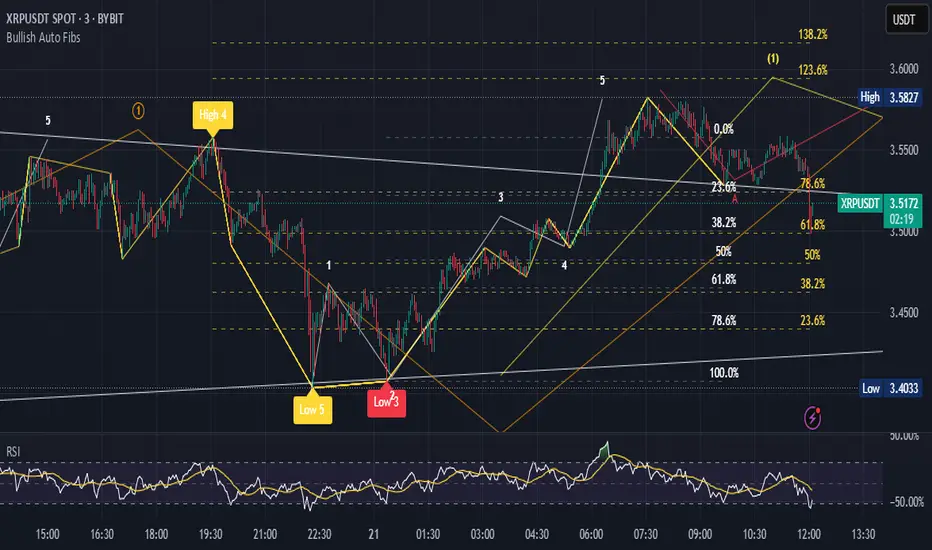
The Bullish Auto Fibs indicator is a sophisticated tool designed for traders on the TradingView platform, specifically tailored for analyzing bullish price movements on XRP and other assets. It automatically plots Fibonacci retracement, B Wave, and extension levels based on a customizable ZigZag pattern, providing clear visual cues for potential support, resistance, and price targets. With a focus on the 15-minute timeframe, this indicator enhances technical analysis by dynamically updating Fibonacci levels as new pivot highs and lows are detected, ensuring traders stay aligned with evolving market trends.
Key Features:
Automatic Fibonacci Levels: Plots retracement (23.6%, 38.2%, 50%, 61.8%, 78.6%), B Wave (23.6% to 161.8%), and extension (100%, 161.8%, 261.8%) levels.
Dynamic ZigZag Detection: Identifies pivot highs and lows with an adjustable length (1–100 bars, default 20).
Real-Time Updates: Adjusts Fibonacci levels when new highs (for retracements) or lows (for B Wave and extensions) are detected, preserving key reference points like the B Wave pivot high.
Customizable Display: Toggle visibility for retracement, B Wave, and extension levels to suit your analysis needs.
Visual Clarity: Uses distinct colors (gray for retracements, yellow for B Wave, green for extensions) and labels for easy interpretation.
This indicator is ideal for traders employing Elliott Wave theory, Fibonacci-based strategies, or trend-following approaches, offering a robust framework for identifying key price levels in bullish markets.
User Manual
Configuration
The indicator’s settings can be adjusted via the “Settings” panel in TradingView:
Yellow ZigZag Length (default: 20, range: 1–100): Controls the sensitivity of pivot detection. Higher values detect more significant pivots; lower values increase sensitivity for shorter-term swings.
Show Retracement Fibs (default: true): Enable/disable retracement levels (low to high, 0% at high, 100% at low).
Show B Wave Fibs (default: true): Enable/disable B Wave levels (high to low, 100% at high, 0% at low, with extensions up to 161.8%).
Show Extension Fibs (default: true): Enable/disable extension levels (pivot low as 0%, projecting upward).
How It Works
ZigZag Pattern:
The indicator identifies pivot highs and lows using the ta.pivothigh and ta.pivotlow functions, with the specified yellowLength.
Pivots are marked with “H” (high) or “L” (low) labels in yellow.
Fibonacci Levels:
Retracement Fibs: Drawn from a pivot low (100%) to a pivot high (0%). Updates to a new high if detected, maintaining the original low.
B Wave Fibs: Drawn from a pivot high (100%) to a pivot low (0%), with extensions above 100%. Updates to a new low if detected, preserving the original high.
Extension Fibs: Drawn from a pivot low (0%) upward, based on the prior low-to-high wave length. Updates to a new low if detected.
Dynamic Updates:
Lines and labels extend to the current bar for active Fibonacci levels, ensuring real-time relevance.
When a new pivot is detected, previous levels are cleared, and new levels are drawn to reflect the latest price structure.
Usage Tips
Trend Confirmation: Use retracement levels to identify potential support zones during pullbacks in a bullish trend.
B Wave Analysis: Leverage B Wave levels for corrective wave targets, especially in Elliott Wave strategies.
Price Targets: Extension levels highlight potential bullish continuation zones.
Timeframe Flexibility: While optimized for 15-minute charts, adjust yellowLength for higher (e.g., 50–100) or lower (e.g., 5–10) timeframes.
Combine with Other Tools: Pair with trend indicators (e.g., moving averages) or oscillators (e.g., RSI) for enhanced decision-making.
Troubleshooting
No Levels Displayed: Ensure at least two pivots (high and low) are detected. Increase yellowLength if pivots are sparse.
Overlapping Labels: Reduce chart zoom or toggle off unnecessary Fibonacci types to declutter.
Performance Issues: The indicator limits arrays to 500 entries to prevent slowdowns. Older pivots are automatically removed.
Notes
The indicator is optimized for bullish markets but can be adapted for other assets by adjusting the ZigZag length.
For best results, test settings on historical data to align with your trading style.
Description
The Bullish Auto Fibs indicator is a sophisticated tool designed for traders on the TradingView platform, specifically tailored for analyzing bullish price movements on XRP and other assets. It automatically plots Fibonacci retracement, B Wave, and extension levels based on a customizable ZigZag pattern, providing clear visual cues for potential support, resistance, and price targets. With a focus on the 15-minute timeframe, this indicator enhances technical analysis by dynamically updating Fibonacci levels as new pivot highs and lows are detected, ensuring traders stay aligned with evolving market trends.
Key Features:
Automatic Fibonacci Levels: Plots retracement (23.6%, 38.2%, 50%, 61.8%, 78.6%), B Wave (23.6% to 161.8%), and extension (100%, 161.8%, 261.8%) levels.
Dynamic ZigZag Detection: Identifies pivot highs and lows with an adjustable length (1–100 bars, default 20).
Real-Time Updates: Adjusts Fibonacci levels when new highs (for retracements) or lows (for B Wave and extensions) are detected, preserving key reference points like the B Wave pivot high.
Customizable Display: Toggle visibility for retracement, B Wave, and extension levels to suit your analysis needs.
Visual Clarity: Uses distinct colors (gray for retracements, yellow for B Wave, green for extensions) and labels for easy interpretation.
This indicator is ideal for traders employing Elliott Wave theory, Fibonacci-based strategies, or trend-following approaches, offering a robust framework for identifying key price levels in bullish markets.
User Manual
Configuration
The indicator’s settings can be adjusted via the “Settings” panel in TradingView:
Yellow ZigZag Length (default: 20, range: 1–100): Controls the sensitivity of pivot detection. Higher values detect more significant pivots; lower values increase sensitivity for shorter-term swings.
Show Retracement Fibs (default: true): Enable/disable retracement levels (low to high, 0% at high, 100% at low).
Show B Wave Fibs (default: true): Enable/disable B Wave levels (high to low, 100% at high, 0% at low, with extensions up to 161.8%).
Show Extension Fibs (default: true): Enable/disable extension levels (pivot low as 0%, projecting upward).
How It Works
ZigZag Pattern:
The indicator identifies pivot highs and lows using the ta.pivothigh and ta.pivotlow functions, with the specified yellowLength.
Pivots are marked with “H” (high) or “L” (low) labels in yellow.
Fibonacci Levels:
Retracement Fibs: Drawn from a pivot low (100%) to a pivot high (0%). Updates to a new high if detected, maintaining the original low.
B Wave Fibs: Drawn from a pivot high (100%) to a pivot low (0%), with extensions above 100%. Updates to a new low if detected, preserving the original high.
Extension Fibs: Drawn from a pivot low (0%) upward, based on the prior low-to-high wave length. Updates to a new low if detected.
Dynamic Updates:
Lines and labels extend to the current bar for active Fibonacci levels, ensuring real-time relevance.
When a new pivot is detected, previous levels are cleared, and new levels are drawn to reflect the latest price structure.
Usage Tips
Trend Confirmation: Use retracement levels to identify potential support zones during pullbacks in a bullish trend.
B Wave Analysis: Leverage B Wave levels for corrective wave targets, especially in Elliott Wave strategies.
Price Targets: Extension levels highlight potential bullish continuation zones.
Timeframe Flexibility: While optimized for 15-minute charts, adjust yellowLength for higher (e.g., 50–100) or lower (e.g., 5–10) timeframes.
Combine with Other Tools: Pair with trend indicators (e.g., moving averages) or oscillators (e.g., RSI) for enhanced decision-making.
Troubleshooting
No Levels Displayed: Ensure at least two pivots (high and low) are detected. Increase yellowLength if pivots are sparse.
Overlapping Labels: Reduce chart zoom or toggle off unnecessary Fibonacci types to declutter.
Performance Issues: The indicator limits arrays to 500 entries to prevent slowdowns. Older pivots are automatically removed.
Notes
The indicator is optimized for bullish markets but can be adapted for other assets by adjusting the ZigZag length.
For best results, test settings on historical data to align with your trading style.
Note di rilascio
color editsNote di rilascio
edit Note di rilascio
you can now pick the next low down to enable a projection of a 5th wave using extension fibsthis also enable retracements of a whole 5wave move to be calculated
Note di rilascio
Altered code to enable movable reference points for each fib drawing.Script protetto
Questo script è pubblicato come codice protetto. Tuttavia, è possibile utilizzarle liberamente e senza alcuna limitazione – ulteriori informazioni qui.
Declinazione di responsabilità
Le informazioni e le pubblicazioni non sono intese come, e non costituiscono, consulenza o raccomandazioni finanziarie, di investimento, di trading o di altro tipo fornite o approvate da TradingView. Per ulteriori informazioni, consultare i Termini di utilizzo.
Script protetto
Questo script è pubblicato come codice protetto. Tuttavia, è possibile utilizzarle liberamente e senza alcuna limitazione – ulteriori informazioni qui.
Declinazione di responsabilità
Le informazioni e le pubblicazioni non sono intese come, e non costituiscono, consulenza o raccomandazioni finanziarie, di investimento, di trading o di altro tipo fornite o approvate da TradingView. Per ulteriori informazioni, consultare i Termini di utilizzo.