MMM @MaxMaserati 2.0
The Backbone of the Max Maserati Method
The MMM MaxMaserati 2.0 indicator is the core of the proprietary Max Maserati Method (MMM), a trading system designed to decode institutional price action. It integrates candle bias analysis, market structure identification, volume-based signals, and precise entry zones to align traders with smart money.
Core Components of the MMM System
1. Six Core Candle Classifications
Master these patterns to reveal institutional behavior:
Bullish Body Close: Closes above previous high, signaling strong buying.
Bearish Body Close: Closes below previous low, indicating intense selling.
Bullish Affinity: High tests previous low, closes within range, showing hidden bullish strength.
Bearish Affinity: Low tests previous high, closes within range, reflecting bearish pressure.
Seek & Destroy: Breaks both previous high/low, closes inside, direction depends on close.
Close Inside: High/low within previous range, bias based on close.
2. Plus/Minus Strength System
Quantifies candle conviction:
Bullish Strength: Low to close distance.
Bearish Strength: High to close distance.
Plus (+): Dominant strength signals strong follow-through.
Minus (-): Balanced strengths suggest caution.
3. PO4 Candles (Power of OHLC (4))
Analyzes OHLC for body-closed candles after swing high/low fractals:
C2: Body close above high/below low post fractal with strength conditions.
C3: Stronger body close with pronounced low/high breakouts.
C4: Body close which show strength and might trigger a BeB/BuB
Visualization: Green (bullish), purple (bearish) bars; triangle markers for fractals.
4. MC2 (High Volume Reversal Candles)
High buy/sell volume candles reversed by opposing volume:
Bullish MC2: Buy volume flipped by sell volume, signaling exhaustion.
Bearish MC2: Sell volume flipped by buy volume, indicating reversal.
Visualization: Dark green (bullish), dark red (bearish) bars.
5. MMM Blocks (eBlocks and iBlocks)
Marks institutional order blocks:
External Blocks (eBlocks): At market structure changes (MSC), labeled BuB/BeB.
Internal Blocks (iBlocks): Within trends, labeled L/S.
Volume: Normalized with indicators (🔥 high, ↑ above average, ↓ low).
Filters: Discount (0-50), premium (50-100), extreme (0-20, 80-100), mid-range (20-50, 50-80).
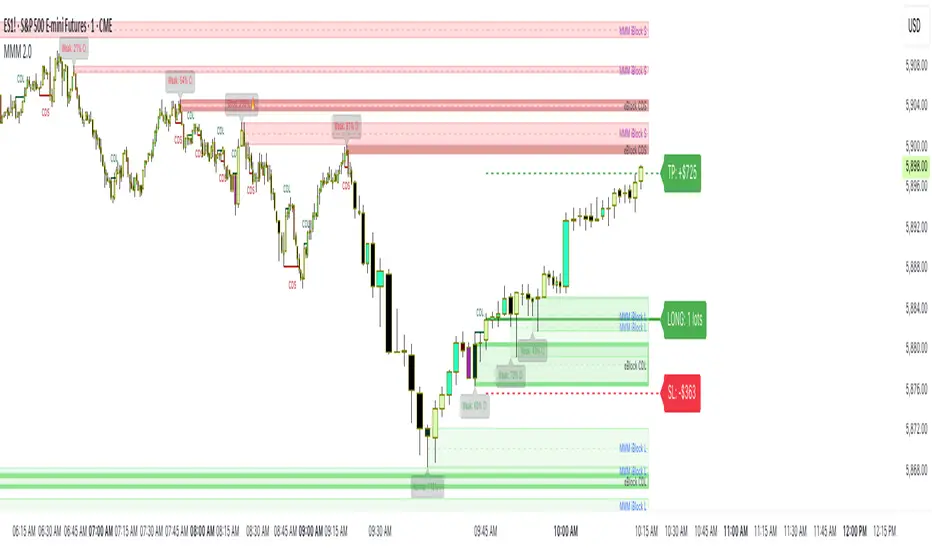
6. Entry Blocks - Specific Entry Areas
Entry Blocks are precise zones for framing trades based on the MMM system, triggered post-MSC to capitalize on institutional momentum:
Purpose: Pinpoint high-probability entry areas following a Market Structure Change (MSC), aligning with smart money direction.
Formation:
MMM Entry Block Long: Forms after a bullish MSC (BuB), typically at the swing low (e.g., lowerValueMSC) of the fractal pattern, marking a long entry zone.
MMM Entry Block Short: Forms after a bearish MSC (BeB), typically at the swing high (e.g., upperValueMSC), marking a short entry zone.
Styles :
Close-to-Swing High/Low: Box drawn from the candle’s close to the swing high/low level, emphasizing the fractal pivot.
High/Low-to-Close: Box drawn from the candle’s high/low to its close, capturing the full price action range.
Visualization:
Labeled “MMM Entry Block Long” (cyan background/border) or “Short” (pink background/border).
Includes a dashed midline for reference.
Volume displayed if enabled, normalized with markers (🔥 >150%, ⚡ >120%, ❄️ <70%).
Behavior:
Deletes when price touches the level (On Level Touch) or closes beyond it (On Candle Close)
Limited to a configurable number ( default 5) to avoid clutter.
Trade Framing:
Entry: Enter within the eBreak box, ideally on a pullback or confirmation candle aligning with MMM bias (e.g., Bullish Body Close or Affinity).
Stop-Loss: Placed below the eBreak low (bullish) or above the high (bearish), leveraging the swing level as support/resistance.
Take-Profit: Targets higher timeframe high (bullish) or low (bearish), with ratio (default 2.0) for risk-reward.
MMM Integration: Use candle bias (Plus/Minus), PO4 signals, and MMPD consensus to confirm entry direction and strength.
Significance: eBreaks frame trades by isolating institutional entry points post-MSC, reducing noise and enhancing precision.
7. Market Structure Change (MSC)
Tracks structure shifts:
Detection: Fractal highs/lows with adjustable candle count.
Visualization: Green (BuB), red (BeB) lines/labels; numbered breaks (Bub1/Beb1).
Counter: Tracks consecutive MSCs for trend strength.
8. MMPD (Market Momentum Price Delivery)
Analyzes momentum/trend:
Conditions: Red (bearish), Green (bullish), Pink (modifying bearish), Pale Green (modifying bullish).
Traps: Flags bullish/bearish traps when MMPD conflicts with body close.
Metrics: SuperMaxTrend, momentum (K/D), MMPD level.
Consensus: Rated signals (e.g., “Very Strong Buy ★★★★★”).
9. Trade and Risk Management
Disciplined trading:
Entry Visualization: Entry, stop-loss, take-profit lines/labels with customizable risk (riskAmount, default $50) and reward (ratio).
Behavior: Shows last/all entries, removes on MSC shift or breach.
Text Size: Tiny, Small, Normal.
NB: The Trade and risk management is to use with caution, it is not fully implemented yet.
10. Stats Table
Real-time dashboard:
Elements: Timeframe, symbol, candle bias, strength, MMPD, momentum, SuperMaxTrend, MMPD level, volume, consensus, divergence, delta MA, price delivery, note (“Analyze | Wait | Repeat”).
Customization: Position, size, element visibility.
Colors: Green (bullish), red (bearish), orange (warnings), gray (neutral).
11. Delta MA and Divergence
Monitors volume delta:
Delta MA: Smoothed delta with direction arrows (↗↘→).
Divergence: Flags MMPD-momentum divergences (⚠️).
Key Features
Automated Analysis: Detects PO4, MSC, blocks, MC2, Entry Block via OHLC.
Color-Coded Visualization: Bars, lines, table cells reflect bias/strength.
Dynamic Bias Lines: Higher timeframe high/low lines with labels.
Volume Analysis: Normalized volume across blocks, entries, MC2.
Flexible Filters: Tailors block/entry Block display to strategies.
Real-Time Metrics: Tracks strength, delta, trend points.
Trading Advantages
Institutional Insight: Decodes manipulation via OHLC and volume.
Early Reversals: Spots shifts via PO4, MC2, MSC, Entry Blocks.
Precise Entries: entry block frame high-probability trades.
Robust Risk Management: Stop-loss, take-profit, risk-reward.
Simplified Complexity: Actionable signals from complex action.
Profit Target Framework
Bullish: Higher timeframe high.
Bearish: Higher timeframe low.
Plus Strength: Direct move.
Minus Strength: Pullbacks expected.
Entry Blocks/MSC-Driven: Entry anchor entries to MSC targets.
Trader’s Mantra
“Analyze | Wait | Repeat” - Discipline drives profits.
The MMM MaxMaserati 2.0 indicator, with Entry Blocks as specific trade-framing zones, offers a professional-grade framework for precise, institutional-aligned trading.
Note: Based on the proprietary Max Maserati Method for educational and analytical use.
- Added option to add amount of lots
- Volume boxes optimized for better reading and stricter control for high volume display when it really matter
- Removed colored bar based on MMM candle bias/ minus and plus for a smoother code
Advice to avoid too many boxes in the chart: If you use eBlock boxes no need to use MMM entry block boxes. The MMM entry box is just a broader area you might expect most things to happen but the eblock is more reliable and precise.
Script su invito
Solo gli utenti approvati dall'autore possono accedere a questo script. È necessario richiedere e ottenere l'autorizzazione per utilizzarlo. Tale autorizzazione viene solitamente concessa dopo il pagamento. Per ulteriori dettagli, seguire le istruzioni dell'autore riportate di seguito o contattare direttamente MaxMaserati.
TradingView NON consiglia di acquistare o utilizzare uno script a meno che non si abbia piena fiducia nel suo autore e se ne comprenda il funzionamento. È inoltre possibile trovare alternative gratuite e open source nei nostri script della community.
Istruzioni dell'autore
Declinazione di responsabilità
Script su invito
Solo gli utenti approvati dall'autore possono accedere a questo script. È necessario richiedere e ottenere l'autorizzazione per utilizzarlo. Tale autorizzazione viene solitamente concessa dopo il pagamento. Per ulteriori dettagli, seguire le istruzioni dell'autore riportate di seguito o contattare direttamente MaxMaserati.
TradingView NON consiglia di acquistare o utilizzare uno script a meno che non si abbia piena fiducia nel suo autore e se ne comprenda il funzionamento. È inoltre possibile trovare alternative gratuite e open source nei nostri script della community.