OPEN-SOURCE SCRIPT
Aggiornato Trend lines
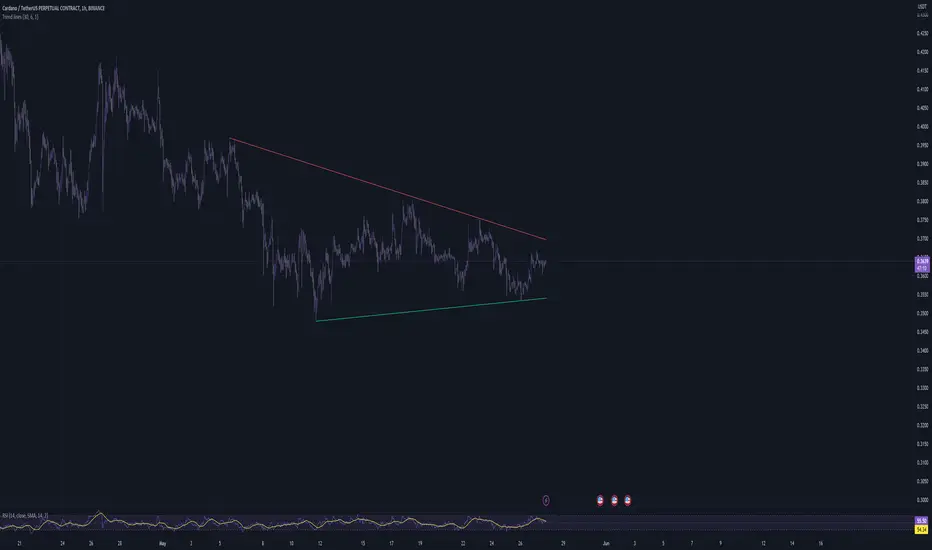
This script aims to identify and plot trend lines and pivot points on a price chart, with the aim of facilitating technical analysis for trading.
The script allows users to configure a number of parameters including the period for Pivot Points, the maximum number of pivots, and the maximum number of trend lines.
Pivot points (local highs and lows in the price data) are identified using TradingView's built-in pivot high and pivot low functions. The identified pivot points are then stored in arrays. The script also optionally plots these points on the chart.
The main goal of the script is to find and plot trend lines based on the pivot points. For each pair of pivot points, it computes the slope of the line connecting them. If all the other pivot points are below this line (for downward trends) or above this line (for upward trends), the line is considered a valid trend line.
The script also includes a feature that suggests potential "buy" or "sell" points along the trend lines. When the price touches the trend line, a label indicating a potential trading action (buy or sell) is created on the chart.
Note di rilascio
fixed a problem where the line crosses the price and doesnt dissapear. Note di rilascio
changed reference imageNote di rilascio
changes to make it a little bit fasterNote di rilascio
- removed signals because this indicator does not need them- updated logic
- added different colors for lines
Script open-source
Nello spirito di TradingView, l'autore di questo script lo ha reso open source, in modo che i trader possano esaminarne e verificarne la funzionalità. Complimenti all'autore! Sebbene sia possibile utilizzarlo gratuitamente, ricordiamo che la ripubblicazione del codice è soggetta al nostro Regolamento.
Declinazione di responsabilità
Le informazioni e le pubblicazioni non sono intese come, e non costituiscono, consulenza o raccomandazioni finanziarie, di investimento, di trading o di altro tipo fornite o approvate da TradingView. Per ulteriori informazioni, consultare i Termini di utilizzo.