OPEN-SOURCE SCRIPT
Elite Pivot Points - 3 time frame
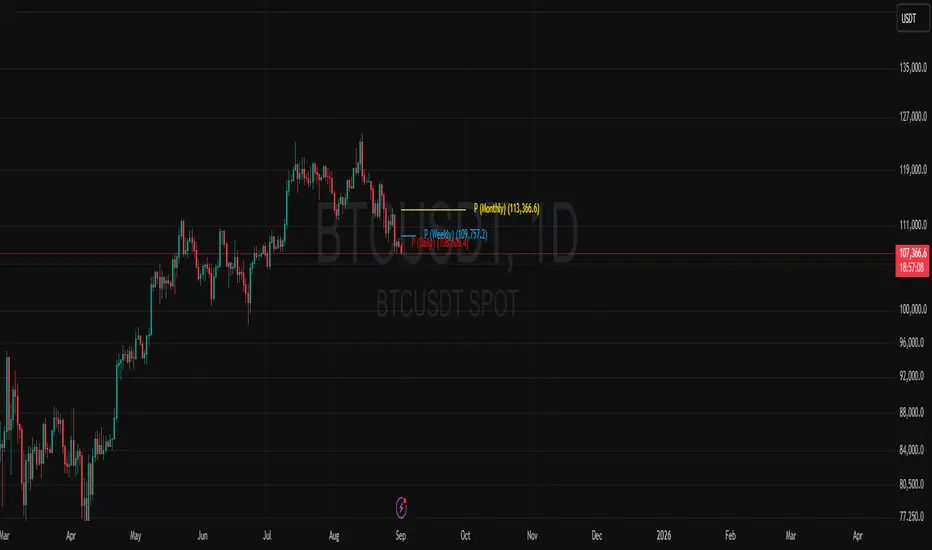
Elite Pivot Points — Multi-timeframe pivots (A/B/C)
Overview
Elite Pivot Points plots up to three pivot frameworks at once on the same chart. Choose the calculation type (Traditional, Fibonacci, Woodie, Classic, Camarilla), pick an independent timeframe for each set (Auto, Daily → Decennially), and set separate colors/visibility for P, S1–S5, and R1–R5. Labels can include prices and the resolved timeframe name (e.g., “Weekly”, “Quarterly”, or “Auto Monthly”).
What’s new in this edition
Adds the ability to display three selectable pivot timeframes simultaneously.
Each timeframe has its own color controls for all levels.
Labels show the chosen timeframe name for clarity.
The original pivot logic/structure remains unchanged.
How it works
Levels are computed using standard formulas for the selected type.
While a higher-timeframe period is open, the current period’s levels can update until that candle closes; historical periods are fixed after close.
Auto picks a source timeframe based on your chart (intraday → Daily/Weekly; weekly/monthly → Yearly by design).
Use Daily-based Values (optional) calculates from the exchange’s daily OHLC on intraday charts (if extended hours are shown, they’re included). Turning it off uses intraday data directly—results can differ by instrument.
Key inputs
Type: Traditional, Fibonacci, Woodie, Classic, Camarilla.
Timeframe A/B/C: Auto, Daily, Weekly, Biweekly, Monthly, Bimonthly, Quarterly, Biquarterly, Yearly, Biyearly, Triyearly, Quinquennially, Decennially.
Show Timeframe A/B/C: Toggle each set on/off.
Number of Pivots Back (per set): How many historical pivot periods to draw.
Use Daily-based Values (per set): Daily OHLC vs. intraday source.
Labels: Show/hide labels and/or prices; choose left/right placement.
Colors & Widths: Independent colors for P, S1–S5, R1–R5 per set; shared line width.
What it draws
Central pivot (P) plus up to five support (S1–S5) and five resistance (R1–R5) levels per selected timeframe.
Label text shows the level and the timeframe name (e.g., R2 (Quarterly)).
Notes & limitations
This is a charting tool, not a signal service; it does not generate trade recommendations.
Current-period levels on higher timeframes may shift until the source period closes.
On symbols where intraday vs. daily OHLC differ (common for stocks), enabling/disabling Use Daily-based Values will intentionally produce different levels.
Best practices
Combine three distinct horizons (e.g., Weekly + Monthly + Quarterly) for multi-frame confluence.
If the chart gets crowded, hide S4/S5 and R4/R5 or reduce Pivots Back.
Align your chart’s session/extended-hours settings with how you compute pivots.
Credits & permission
Original indicator by TboneKrypto (closed-source). This edition is published with the author’s permission. It expands display options to three independent pivot timeframes with per-set colors while keeping the original logic intact. No affiliation or endorsement implied.
Disclaimer
For educational purposes only. This is not financial advice or a solicitation to buy or sell any asset. Trading involves risk. Always do your own research and manage risk appropriately.
Script open-source
In pieno spirito TradingView, il creatore di questo script lo ha reso open-source, in modo che i trader possano esaminarlo e verificarne la funzionalità. Complimenti all'autore! Sebbene sia possibile utilizzarlo gratuitamente, ricorda che la ripubblicazione del codice è soggetta al nostro Regolamento.
Declinazione di responsabilità
Le informazioni ed i contenuti pubblicati non costituiscono in alcun modo una sollecitazione ad investire o ad operare nei mercati finanziari. Non sono inoltre fornite o supportate da TradingView. Maggiori dettagli nelle Condizioni d'uso.