PROTECTED SOURCE SCRIPT
Aggiornato Directional filter
The idea is to show simply through colors "stronger or weaker" the relevance of candles in the current direction of the asset.
the indicator was made to be used in the graphics of 5m and 15m. based on the SMA20 already indicated previously and with a SMA20 of the graph of 60m.
candles will have their colors modified according to their relevance in the current trend, "A" through "D", where "A" is the strongest and "D" is the weakest.
Conditions:
Buy candle A: price closes above SMA20 (5m or 15m) and above SM20 of 60m.
Buy candle B: price closes above the SMA20 (5m or 15m) and below the SMA20 of 60m.
Buy candle C: Price closes below the SMA20 (5m or 15m) and above the SMA20 60m.
Buy candle D: price closes below the SMA20 (5m or 15m) and below the SMA20 of 60m.
Sell candle A: price closes below the SMA20 (5m or 15m) and below the SMA20 of 60m.
Sell candle B: price closes below the SMA20 (5m or 15m) and above the SMA20 of 60m.
Sell candle C: price closes above the SMA20 (5m or 15m) and below the SMA20 of 60m.
Sell candle D: price closes above the SMA20 (5m or 15m) and above the SMA20 of 60m.
Note 1: SMA8 and SMA200 are also inserted (but they do not interfere with the indicator)
Note 2:
I will leave an image with the colors that represent the relevance of each candle.
https://imageshack.com/a/img921/1808/uv3Wo8.png
Note di rilascio
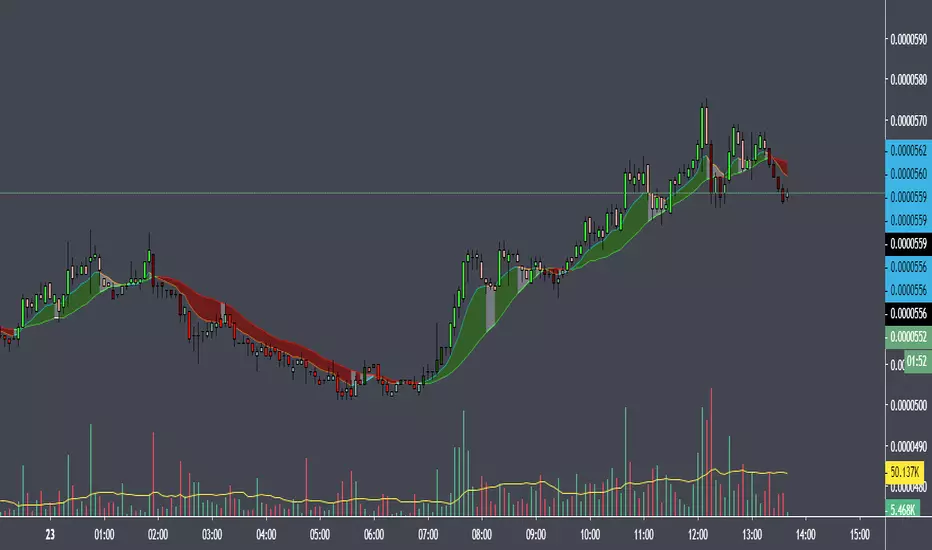
the update is available to change the color of the SMA 20 (5min or 15min) according to the direction and the asset is.Green = SMA20 UP
Red = SMA20 DOWN
White = NEUTRAL
Note di rilascio
Version 3.0 did the exchange of SMA 8 by EMA 9when the EMA 9 is up your color will be blue, when it is down your color will be orange.
There was no change in the colors of the candles
Note di rilascio
Replacement of SMA 20 by EMA 21.Note di rilascio
All SMA 20 were replaced by EMA 21Note di rilascio
Update to fill the zone between the EMAs selected according to the current price of the asset.price closed above EMAs = green fill
price closed below the EMAs = red fill
price closed between EMAs = white fill
Note di rilascio
fill correctionNote di rilascio
I found it more appropriate to exchange EMA 20 for SMA 21.Note di rilascio
a small correction in the names of the settingsScript protetto
Questo script è pubblicato come codice protetto. Tuttavia, è possibile utilizzarle liberamente e senza alcuna limitazione – ulteriori informazioni qui.
Declinazione di responsabilità
Le informazioni e le pubblicazioni non sono intese come, e non costituiscono, consulenza o raccomandazioni finanziarie, di investimento, di trading o di altro tipo fornite o approvate da TradingView. Per ulteriori informazioni, consultare i Termini di utilizzo.
Script protetto
Questo script è pubblicato come codice protetto. Tuttavia, è possibile utilizzarle liberamente e senza alcuna limitazione – ulteriori informazioni qui.
Declinazione di responsabilità
Le informazioni e le pubblicazioni non sono intese come, e non costituiscono, consulenza o raccomandazioni finanziarie, di investimento, di trading o di altro tipo fornite o approvate da TradingView. Per ulteriori informazioni, consultare i Termini di utilizzo.