OPEN-SOURCE SCRIPT
Aggiornato [RS][NM]Improved Linear Regression Bull and Bear Power v01
The base code for this indicator was created by RicardoSantos
What I added is a signal line that indicates when to buy and when to sell.
Advised use :
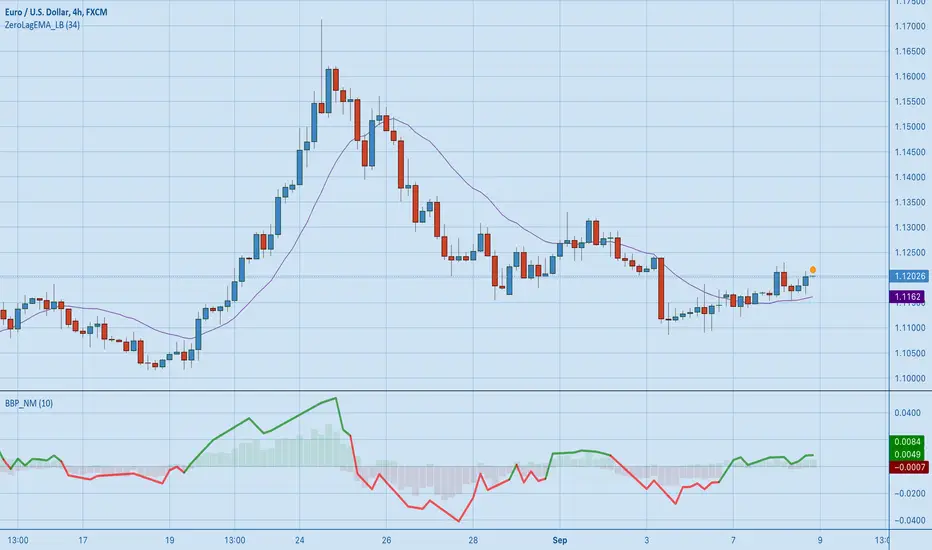
Combine with a zero-lag indicator like ZeroLagEMA_LB by LazyBear (suggested period = 34)
Then use the following Rules of engagement :
Current price > ZLEMA & Signal line of BBP_NM is green : BUY
Current price < ZLEMA & Signal line of BBP_NM is red : SELL Please click the like button if you dig this indicator !
What I added is a signal line that indicates when to buy and when to sell.
Advised use :
Combine with a zero-lag indicator like ZeroLagEMA_LB by LazyBear (suggested period = 34)
Then use the following Rules of engagement :
Current price > ZLEMA & Signal line of BBP_NM is green : BUY
Current price < ZLEMA & Signal line of BBP_NM is red : SELL Please click the like button if you dig this indicator !
Nota
I have found a little calculation error in this script where if there is no data for either bull or bear volume, the indicator will not plot. This has been corrected in version 2 ![[NM]Improved Linear Regression Bull and Bear Power v02](https://s3.tradingview.com/g/GQZct22g_mid.png)
Script open-source
In pieno spirito TradingView, il creatore di questo script lo ha reso open-source, in modo che i trader possano esaminarlo e verificarne la funzionalità. Complimenti all'autore! Sebbene sia possibile utilizzarlo gratuitamente, ricorda che la ripubblicazione del codice è soggetta al nostro Regolamento.
Check out my FREE indicator scripts:
► tradingview.com/u/Profit_Through_Patience/
► tradingview.com/u/Profit_Through_Patience/
Declinazione di responsabilità
Le informazioni ed i contenuti pubblicati non costituiscono in alcun modo una sollecitazione ad investire o ad operare nei mercati finanziari. Non sono inoltre fornite o supportate da TradingView. Maggiori dettagli nelle Condizioni d'uso.